Field Notes

<--2018-03-19 08:30:00 | 2018-04-05 11:50:00-->
Other sites visited today: Sherman Wetland | East End
Phenocam link: Searching...

Twitchell Alfalfa: 2018-03-31 12:00:00 (DOY 90)
Author: Elke Eichelmann
Others: 25 students from SFSU

Summary: Field visit with students from SFSU and Andrew Oliphant

I came to the Delta with about 25 students from San Francisco State University and Andrew Oliphant as part of his class.

It was a nice day, very warm and calm, with only a few high thin wispy clouds.

We stopped at Twitchell Alfalfa around 12noon and had a look at the Eddy Flux tower and instruments. I hooked up the computer to show the students the readings for the 7500 and the sonic. I did not clean the instruments, since they still looked fairly clean.

CO2 was around 400ppm
H2O around 600 mmol/m3
SS around 104
I didn't write down any of the numbers, so this is from memory.

The solar panels were pretty dirty. We didn't have anything to clean them, but they should get a good clean next time we go out.

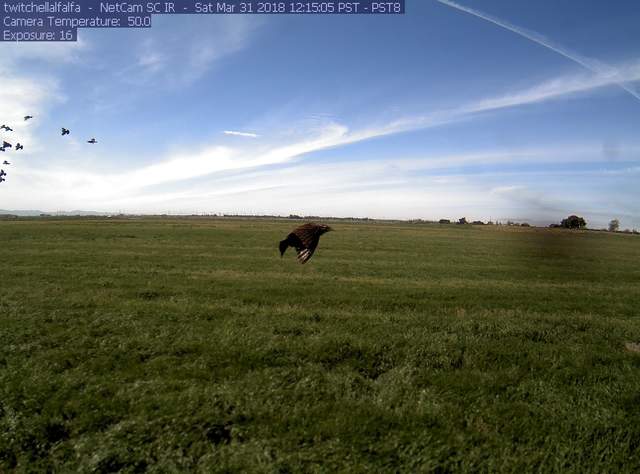
1 photos found

Starlings in flight
twitchellalfalfa2_2018_03_31_121505.jpg ( 2018-03-31 12:16:04 ) Full size: 1296x960
Starlings in flight

Graphs display:
7 sets found

Can't check TA_met
11 TA_met graphs found

Explore the graph:Alfalfa Temperatures in a new window

Explore the graph:Alfalfa Soil Heat Flux in a new window

Explore the graph:Alfalfa Soil Moisture in a new window

Explore the graph:Alfalfa Soil Temperatures Set A in a new window

Explore the graph:Alfalfa Soil Temperatures Set B in a new window

Explore the graph:Alfalfa Soil Temperatures Set C in a new window

Explore the graph:NDVI Narrow Band Radiation in a new window

Explore the graph:Soil CO2 Flux in a new window

Explore the graph:Relative Humidity and BattV in a new window

Explore the graph:SRS NDVI and PRI in a new window

Explore the graph:PRI Narrow Band Channels in a new window

Can't check TA_rad
3 TA_rad graphs found

Explore the graph:Alfalfa Radiation in a new window

Explore the graph:Alfalfa LED NDVI Sensor in a new window

Explore the graph:Alfalfa PAR in a new window

Can't check TA_flux
5 TA_flux graphs found

Explore the graph:Alfalfa Sonic Wind in a new window

Explore the graph:Alfalfa CO2 and H2O in a new window

Explore the graph:Alfalfa Methane in a new window

Explore the graph:Alfalfa Pressure in a new window

Explore the graph:Alfalfa Flux Data Counts in a new window

Can't check TA_soilco2
7 TA_soilco2 graphs found

Explore the graph:Set A Soil CO2 in a new window

Explore the graph:Set B Soil CO2 in a new window

Explore the graph:Soil CO2 Soil Moisture in a new window

Explore the graph:Forced Diffusion CO2 in a new window

Explore the graph:Alfalfa Forerunner Soil CO2 in a new window

Explore the graph:Alfalfa Forerunner Temperatures in a new window

Explore the graph:Alfalfa Forerunner Probe RH in a new window

1 TA_arable graphs found

Explore the graph:Temperatures in a new window

1 TA_cam graphs found

Explore the graph:GCC in a new window

Can't check TATWBABCSB_cam