Field Notes
<--2006-03-30 10:00:00 |
2006-04-19 11:47:00-->
Phenocam link:
Searching...Tonzi: 2006-04-18 09:25:00 (DOY 108)
Author: Siyan Ma
Others:
When: Date: 4/18/2006 ,
Day: 108 ,
Watch Time: 9:25 .
Where: Tonzi/Vaira Ranch
Who: Siyan
Weather:
clear, nice breeze, warm but not hot
Phenology:
It was very diverse in phenology at Vaira grassland. Stem height increased in some patch
(~40%). I even saw some individuals
blooming (<10%). The other 50% seemed
still on stem splitting stage. At Tonzi,
grass height increased, too. I saw
yellow and pink followers. Oak trees
leaf out 100%.
Summary
- EC system was working well at
the three sites. Data were
downloaded.
- Li_7500 at Vaira was swapped.
- Three channels of soil CO2 profile system were out of range.
- Collected grass sample for
LAI and phenology in Tower and Vaira, oak leaves and branches for N
- Collected oak woody and grass
samples in Tonzi for Alex’s MIBA-US-03. Because previous samples haven’t
been analyzed in time, sampling frequency start to be once a month.
- Measured soil moisture, dendrometer.
- No consine filter was applied
in spectrum measurement. The consine corrector of the spectrometer is in
order, not arrived yet.
Vaira_Grass
Site
- Fence and gate power: >12 v.
- Panel and Batteries: 13.9 v; 12.6 amps; 2.9 amps.
- Reading from Gillsonic screen
before downloading data. (The value
of H2O and CO2 should be in the range of 0 – 5 v.)
Time
|
8:27:03
|
Path/File name
|
D:\Data\V06_ 107 .flx
D:\Data\VR06
1071400 .raw
|
|
mean
|
std
|
|
mean
|
std
|
w
|
.18
|
.252
|
Ts
|
14.459
|
.53
|
u
|
.33
|
.317
|
H2O
|
1.44
|
.096
|
v
|
.10
|
.637
|
CO2
|
1.95
|
.031
|
- downloading data
- swaping Li-7500
Analyzer. (Remove SN# 41 ; install SN# 42 )
- check the fans of air temp.
and relative humidity sensors at Vaira.
Good!
- Check MD-9 system connections: BUSY WITH COM
- Check levels of Radiation
sensors, clear up surfaces.
9. Closed gate and
set up fence.
Tonzi_Tower Site
- Fence and gate power: >12 v.
- Panel and Batteries: 13.5 v; 0.0 amps; 3.0 amps.
- Reading from Gillsonic screen
before downloading data. (The value
of H2O and CO2 should be in the range of 0 – 5 v.)
Time
|
10:07:10
|
Path/File name
|
D:\Data\T06_ 108 .flx
D:\Data\TW06
1081000 .raw
|
|
mean
|
std
|
|
mean
|
std
|
w
|
.03
|
.531
|
Ts
|
14.84
|
.505
|
u
|
2.29
|
.515
|
H2O
|
2.303
|
.574
|
v
|
.570
|
.750
|
CO2
|
2.081
|
.026
|
- downloading data
- check the fans of air temp.
and relative humidity sensors on the tower and the floor. Good!
- CO2 profile system in the
lab.
- close gate and set up fence.
Toniz_Floor
Site
- Fence and gate power: >12 v.
- Panel and Batteries: 13.8 v; 13.8 amps; 1.8
amps.
- Reading from Gillsonic screen
before downloading data. (The value
of H2O and CO2 should be in the range of 0 – 5 v.)
Time
|
10:25:01
|
Path/File name
|
D:\Data\F06_104 .flx
D:\Data\FL06 1041230 .raw
|
|
mean
|
std
|
|
mean
|
std
|
w
|
-0.50
|
1.259
|
Ts
|
15.9
|
.35
|
u
|
-0.29
|
1.259
|
H2O
|
3.702
|
.12
|
v
|
0.350
|
0.605
|
CO2
|
2.19
|
.032
|
- downloading data
- Soil CO2 profile
Reading
from datalogger
Panel
temp
|
20.8
|
|
|
Battery
voltage
|
13.7
|
|
|
CO2E_1
|
-9999
|
TCE_1
|
20.523
|
CO2W_1
|
1434.1
|
TCW_1
|
14.87
|
CO2E_2
|
2965.9
|
TCE_2
|
21.154
|
CO2W_2
|
2433.1
|
TCW_2
|
13.18
|
CO2E_3
|
3305.1
|
TCE_3
|
16.56
|
CO2W_3
|
-9999
|
TCW_3
|
13.85
|
CO2E_4
|
4129.0
|
TCE_4
|
13.91
|
CO2W_4
|
-9999
|
TCW_4
|
13.52
|
Reading
from panels of analyzers
depth
|
Open
|
order
|
depth
|
Tree
|
order
|
2cm
(1%)
|
1.64%
|
1
|
2cm
(1%)
|
2860
|
1
|
4cm
|
5650
|
2
|
4cm
|
1.91%
|
4
|
8cm
|
6720
|
3
|
8cm
|
4870
|
2
|
16cm
|
8260
|
4
|
16cm
|
2.56%
|
3
|
- Close gate and set up fence.
tonzi
|
7931AFE
|
402165
|
574B4B
|
402FF3
|
574632
|
7A432E
|
7A3C6E
|
7A3B40
|
7A4AAA
|
D108
|
|
|
|
|
|
|
|
|
|
18-Apr-06
|
SM
|
|
|
|
|
|
|
|
|
0-15
|
45.7
|
45.0
|
47.8
|
35.2
|
42.4
|
36.2
|
31.4
|
31.0
|
31.4
|
15-30
|
32.8
|
42.9
|
37.1
|
40.7
|
39.1
|
33.5
|
30.3
|
35.2
|
29.9
|
30-45
|
36.5
|
42.8
|
42.7
|
40.7
|
45.0
|
35.4
|
33.9
|
34.7
|
37.5
|
45-60
|
38.6
|
56.7
|
54.4
|
44.1
|
42.6
|
34.0
|
44.0
|
47.7
|
40.6
|
|
|
|
|
|
|
|
|
|
|
|
A6D882B
|
A3D04E8
|
A6D72F5
|
|
|
|
|
|
|
|
|
|
|
|
|
|
|
|
|
0-15
|
37.3
|
36.6
|
29.0
|
|
|
|
|
|
|
15-30
|
31.7
|
35.5
|
34.5
|
|
|
|
|
|
|
30-45
|
36.0
|
34.0
|
35.6
|
|
|
|
|
|
|
45-60
|
43.1
|
48.3
|
45.9
|
|
|
|
|
|
|
|
|
|
|
|
|
|
|
|
|
vaira
|
57318a
|
7933dee
|
|
|
|
|
|
|
|
0-15
|
20.1
|
11.1
|
|
|
|
|
|
|
|
15-30
|
28.4
|
21.5
|
|
|
|
|
|
|
|
30-45
|
31.3
|
23.6
|
|
|
|
|
|
|
|
45-60
|
32.1
|
34.8
|
|
|
|
|
|
|
|
Tonzi
|
|
|
|
Dendrometer
|
|
|
|
|
|
|
Date
|
Day
|
Tag #
|
Reading (cm)
|
4/18/2006
|
108
|
71
|
22.5
|
|
|
72
|
23.5
|
|
|
77
|
Broken
|
|
|
78
|
Broken
|
|
|
79
|
23.3
|
|
|
245
|
22.0
|
|
|
248
|
24.5
|
|
|
250
|
21.7
|
|
|
255
|
22.9
|
|
|
252
|
missing
|
|
|
102
|
Broken
|
Sample sheet for MIBA
Sample vial
|
What
|
MIBA-US-01.164
|
Leave 1
|
MIBA-US-01. 165
|
Leave 2
|
MIBA-US-01. 166
|
Grass 1
|
MIBA-US-01. 167
|
Grass 2
|
MIBA-US-01. 168
|
Soil in 10 cm
|
MIBA-US-01. 169
|
Stem 1
|
MIBA-US-01. 170
|
Stem 2
|
|
Field Data
No tank data
No TZ Well data found
No TZ Moisture Point data found
No VR Moisture Point data found
No TZ grass heigth found
No VR grass heigth found
No TZ Tree DBH found
No water potential data found
No TZ Grass Biomass data found
No TZ OakLeaves Biomass data found
No TZ PineNeedles Biomass data found
0 photos found
16 sets found
No data found for TZ_Fenergy.
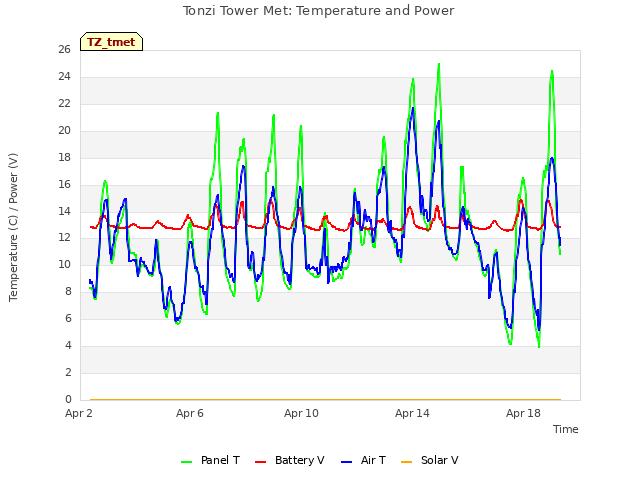
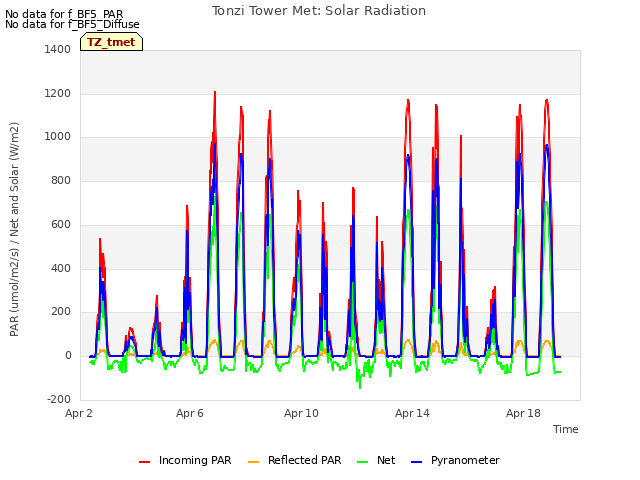
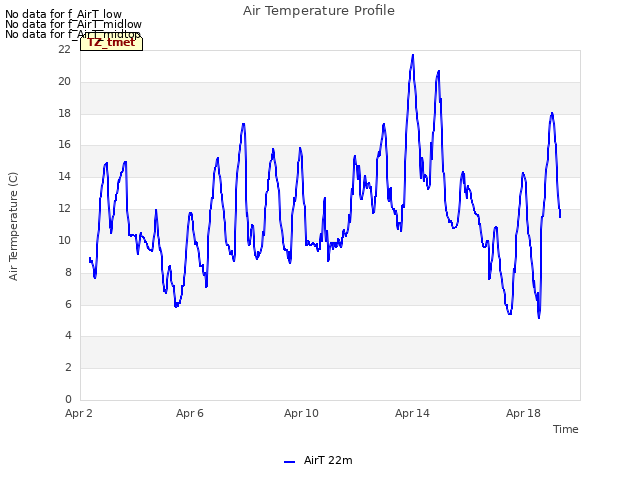
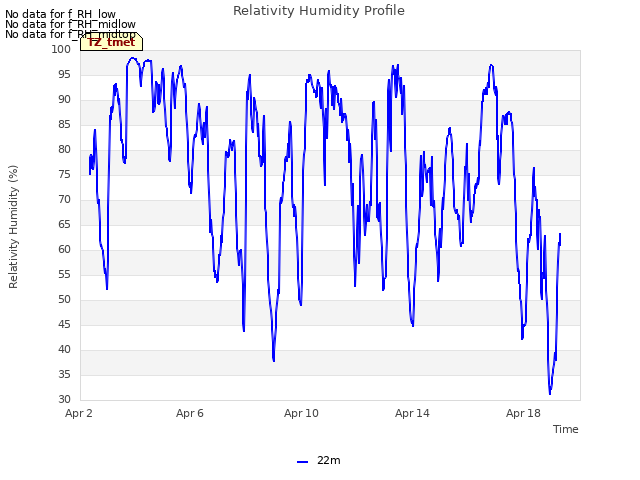
11 TZ_tmet graphs found


No data found for TZ_soilco2.
Can't check TZ_mixed
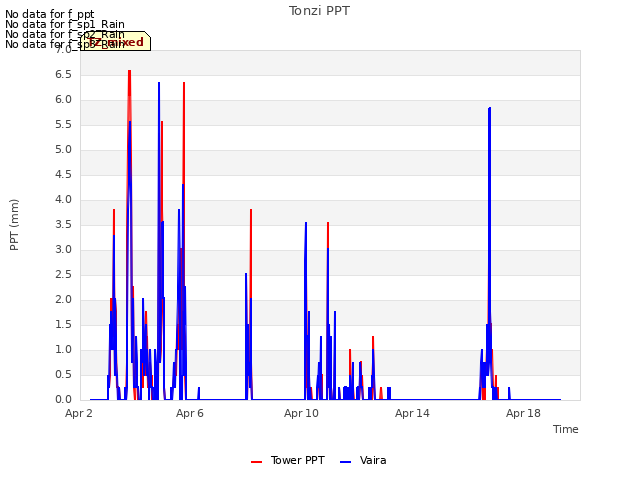
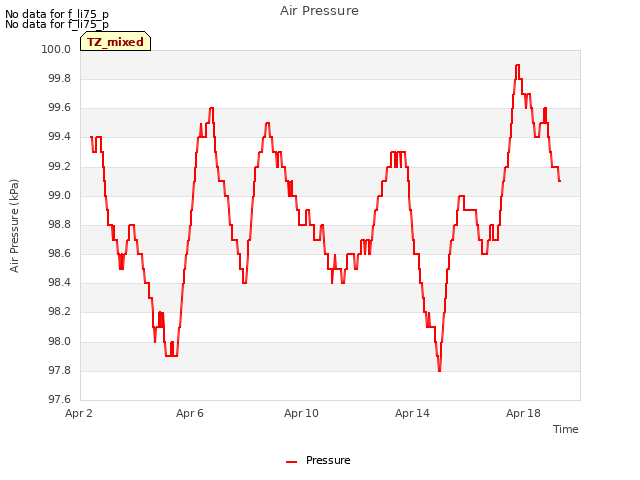
3 TZ_mixed graphs found

No data found for TZ_fflux.
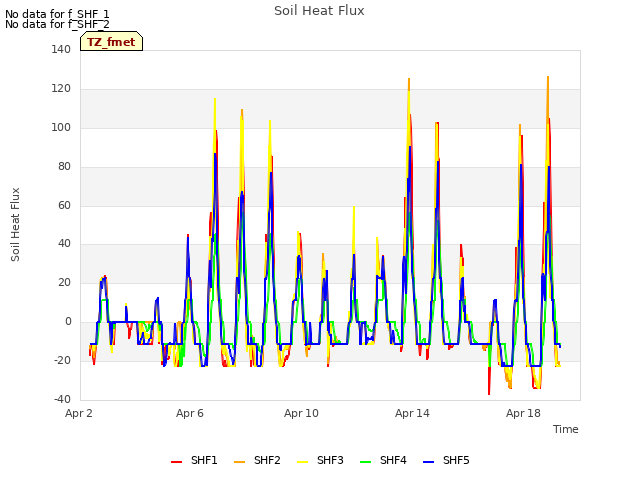
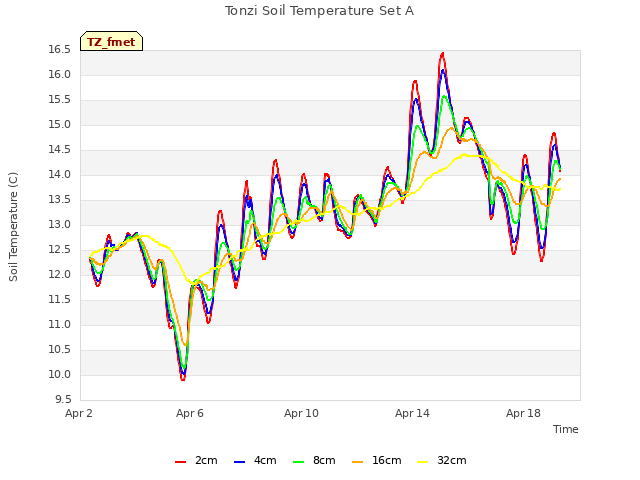
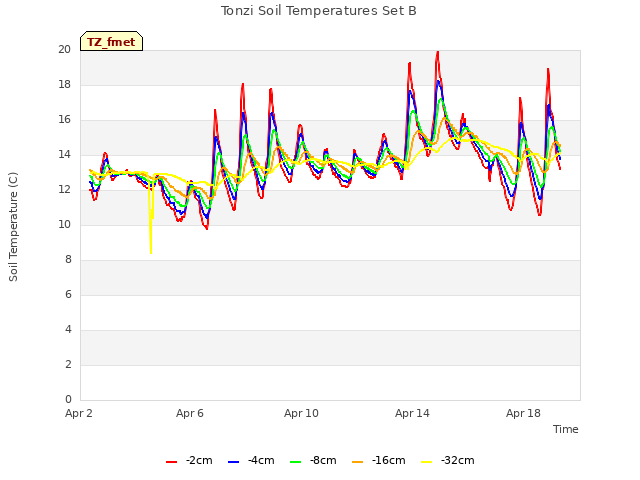
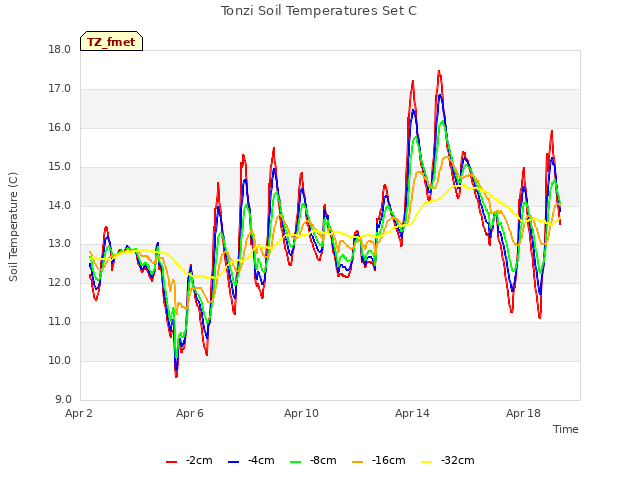
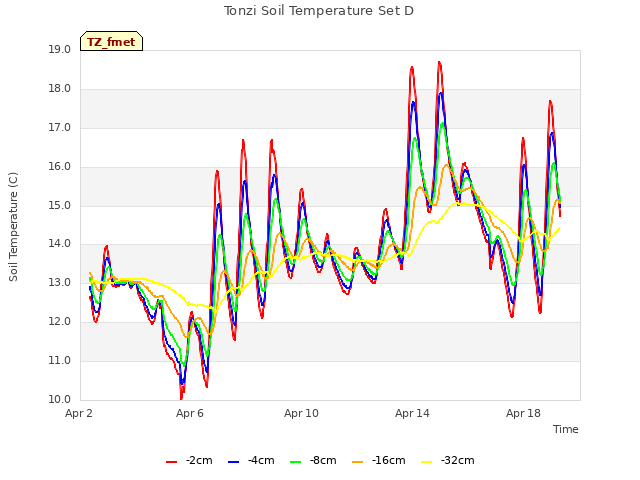
8 TZ_fmet graphs found


No data found for TZ_tram.
No data found for TZ_co2prof.
No data found for TZ_irt.
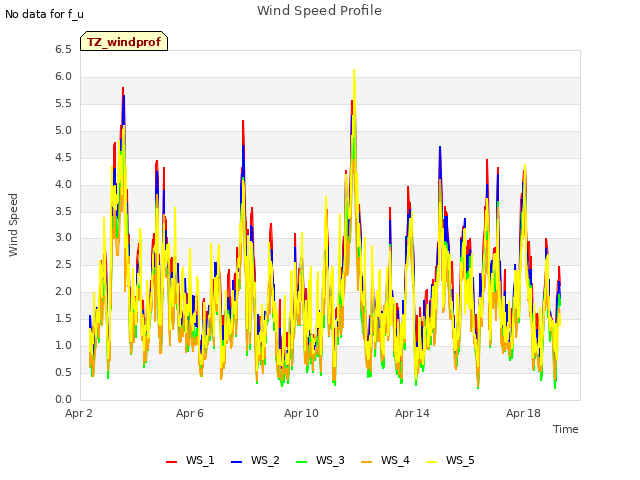
1 TZ_windprof graphs found
No data found for TZ_tflux.
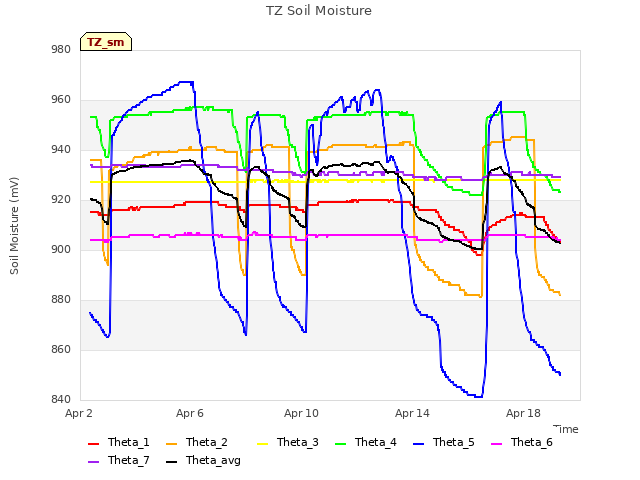
2 TZ_sm graphs found

Can't check TZ_met
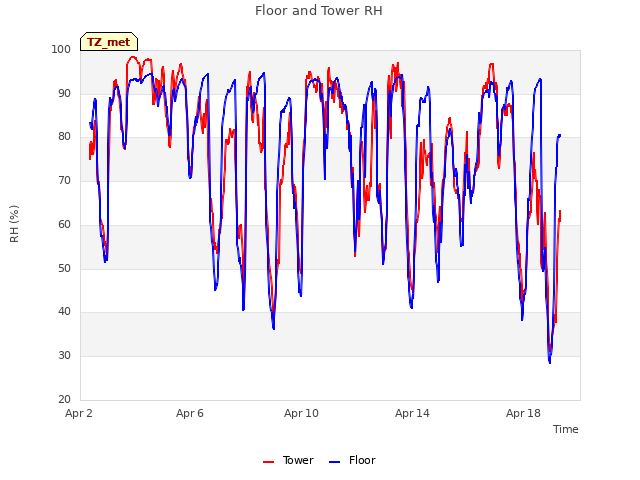
1 TZ_met graphs found
Can't check TZVR_mixed
No data found for TZ_osu.
No data found for TZ_fd.
Tonzi Z-cam data


