Field Notes
<--2006-02-09 00:00:00 |
2006-02-23 10:30:00-->
Other sites visited today:
Tonzi
Phenocam link:
Searching...Tonzi: 2006-02-09 10:30:00 (DOY 40)
Author: Siyan Ma
Others:
When: Date: 2/10/2006 ,
Day: 40 ,
Watch Time: 10:30am .
Where: Tonzi/Vaira Ranch
Who: Siyan
Weather:
clear, ~70oF
Phenology:green
grass, very patchy. Somewhere still seen brown debris patches at both
sites. At Vaira, grass looked stronger
and bigger by the side of debris patch than those without debris
surrounding. More splitting stems were
observed at Vaira, but new sprouting grass was still going on. The grass phenology was very dynamic. The mass structure of grass seems very
interesting. Tonzi’s grass didn’t have
too many stem-spliting yet. Talk to Mr.
Tonzi. He mentioned that he’s expecting
to see oak leaves come out earlier this spring, maybe earlier than March 1,
especially the tree on the corner of his house, because it wasn’t too clod in
the winter down the valley, only a few days.
He was working on his fence recently.
His old fence poles were red wood and stood in the field over one
hundred years. Some of the bottoms had
been decayed.
Summary
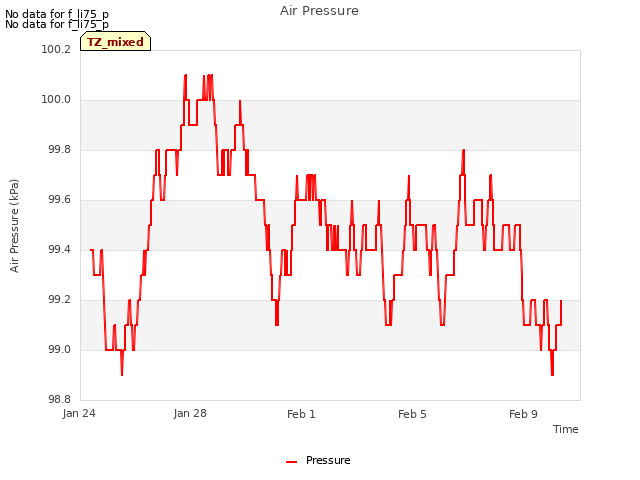
- Vaira’s Pressure may not work well because it is quite different
from Tonzi’s.
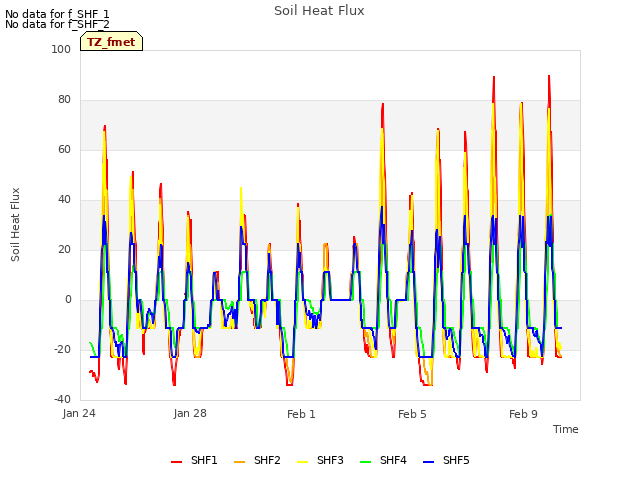
- Flux system worked well.
- Soil CO2 profile system: didn’t make it at night because of the
power drop. Already notice Ted and he will check on it. The 4th channel under the
tree didn’t work (-9999).
- collected oak woody and grass samples in Tonzi f
or Alex.
- collected grass samples for grass LAI
- measured soil moisture, dendrometer,
and spectrometer
Vaira_Grass
Site
- Fence and gate power: >12 v.
- Panel and Batteries: 13.7 v; 13.1 amps; 2.4 amps.
- Reading from Gillsonic screen
before downloading data. (The value
of H2O and CO2 should be in the range of 0 – 5 v.)
Time
|
11:07:35
|
Path/File name
|
D:\Data\V06_040.flx
D:\Data\VR060401100.raw
|
|
mean
|
std
|
|
mean
|
std
|
w
|
0.23
|
0.292
|
Ts
|
21.873
|
1.677
|
u
|
-1.078
|
0.694
|
H2O
|
2.394
|
0.179
|
v
|
1.51
|
0.459
|
CO2
|
1.926
|
0.063
|
- downloading data
- check the fans of air temp.
and relative humidity sensors at Vaira.
Good!
- Check CR23X with two
multiplexers: “Busy with com”
Sys_vot = couldn’t check
PC_start = couldn’t
check
- Check levels of Radiation
sensors, clear up surfaces.
9. Closed gate and
set up fence.
Tonzi_Tower Site
- Fence and gate power: >12 v, but the fence door wasn’t closed.
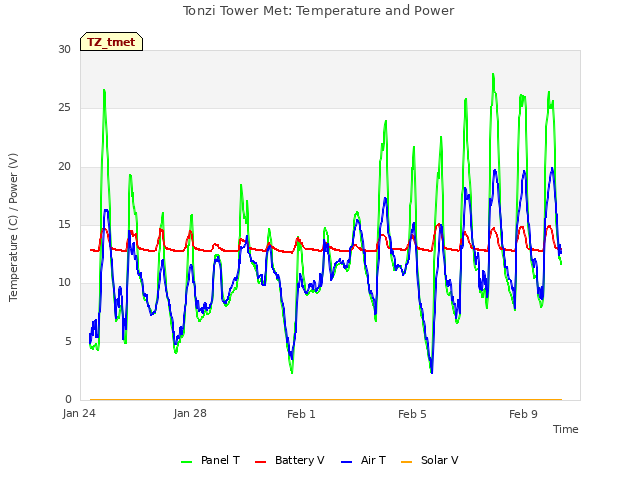
- Panel and Batteries: 13.4 v; 0.0 amps; 5.0 amps.
- Reading from Gillsonic screen
before downloading data. (The value
of H2O and CO2 should be in the range of 0 – 5 v.)
Time
|
12:34:19
|
Path/File name
|
D:\Data\T06_040.flx
D:\Data\TW060401100.raw
|
|
mean
|
std
|
|
mean
|
std
|
w
|
0.01
|
0.615
|
Ts
|
19.379
|
0.443
|
u
|
2.22
|
1.278
|
H2O
|
2.301
|
0.024
|
v
|
0.82
|
0.661
|
CO2
|
1.702
|
0.024
|
- downloading data
- check the fans of air temp.
and relative humidity sensors on the tower and the floor. Good!
- Check calibration cylinders;
CO 2 2000
psig; flow 10 psi.
N 2 2000
psig; flow 10 psi.
Is the pump running Yes.
- close gate and set up fence.
Toniz_Floor
Site
- Fence and gate power: >12 v.
- Panel and Batteries: 13.2 v; 8.0 amps; 1.7 amps.
- Reading from Gillsonic screen
before downloading data. (The value
of H2O and CO2 should be in the range of 0 – 5 v.)
Time
|
|
Path/File name
|
D:\Data\T06_040.flx
D:\Data\TW060401100.raw
|
|
mean
|
std
|
|
mean
|
std
|
w
|
0.30
|
0.239
|
Ts
|
19.55
|
0.491
|
u
|
0.34
|
0.53
|
H2O
|
2.22
|
0.133
|
v
|
0.9
|
0.349
|
CO2
|
1.918
|
0.95
|
- downloading data
- Check MD-9 system connections
CR23X3 – floor-Met
CR23X5 – soil CO 2
profile Good.
CR23X6 – tower-Met
CR10X2 – floor-Met
CR10X4 – sap-flow
CR10X7 – CO 2 profile
CR10X8 – wind profile
- Soil CO2 profile
Reading
from datalogger
Panel
temp
|
25.3
|
|
|
Battery
voltage
|
13.77
|
|
|
CO2E_1
|
2826.2
|
TCE_1
|
15.1
|
CO2W_1
|
1158.2
|
TCW_1
|
21
|
CO2E_2
|
3877.2
|
TCE_2
|
20.7
|
CO2W_2
|
1700.3
|
TCW_2
|
13.8
|
CO2E_3
|
1880.0
|
TCE_3
|
15.4
|
CO2W_3
|
4885.6
|
TCW_3
|
13.8
|
CO2E_4
|
3970.0
|
TCE_4
|
10.8
|
CO2W_4
|
-9999
|
TCW_4
|
14.7
|
Reading
from panels of analyzers
depth
|
Open
|
order
|
depth
|
Tree
|
order
|
2cm
(1%)
|
5640
|
1
|
2cm
(1%)
|
2340
|
1
|
4cm
|
1650
|
2
|
4cm
|
1.20%
|
4
|
8cm
|
3830
|
3
|
8cm
|
3410
|
2
|
16cm
|
7140
|
4
|
16cm
|
197%
|
3
|
- Close gate and set up fence.
tonzi
|
7931AFE
|
402165
|
574B4B
|
402FF3
|
574632
|
7A432E
|
7A3C6E
|
7A3B40
|
7A4AAA
|
D040
|
|
|
|
|
|
|
|
|
|
10-Feb-06
|
SM
|
|
|
|
|
|
|
|
|
0-15
|
39.9
|
37.2
|
42.9
|
22.6
|
33.2
|
38.6
|
25.5
|
24.7
|
21.3
|
15-30
|
39.0
|
41.1
|
39.5
|
39.7
|
26.3
|
39.7
|
28.8
|
33.5
|
20.2
|
30-45
|
37.7
|
42.2
|
41.3
|
37.9
|
32.9
|
43.2
|
37.9
|
32.7
|
33.8
|
45-60
|
40.1
|
54.5
|
55.4
|
43.1
|
32.0
|
39.8
|
43.4
|
44.2
|
31.2
|
|
|
|
|
|
|
|
|
|
|
|
A6D882B
|
A3D04E8
|
A6D72F5
|
|
|
|
|
|
|
|
|
|
|
|
|
|
|
|
|
0-15
|
35.7
|
31.8
|
21.0
|
|
|
|
|
|
|
15-30
|
28.2
|
29.4
|
31.4
|
|
|
|
|
|
|
30-45
|
34.3
|
35.4
|
34.6
|
|
|
|
|
|
|
45-60
|
41.2
|
46.2
|
44.8
|
|
|
|
|
|
|
|
|
|
|
|
|
|
|
|
|
vaira
|
57318a
|
7933dee
|
|
|
|
|
|
|
|
0-15
|
21.5
|
24.9
|
|
|
|
|
|
|
|
15-30
|
26.4
|
33.6
|
|
|
|
|
|
|
|
30-45
|
27.8
|
33.9
|
|
|
|
|
|
|
|
45-60
|
31.5
|
33.4
|
|
|
|
|
|
|
|
Tonzi
|
|
|
|
Dendrometer
|
|
|
|
|
|
|
Date
|
Day
|
Tag #
|
Reading (cm)
|
2/10/2006
|
40
|
71
|
22.3
|
|
|
72
|
23.3
|
|
|
77
|
Broken
|
|
|
78
|
Broken
|
|
|
79
|
22.9
|
|
|
245
|
20.2
|
|
|
248
|
24.0
|
|
|
250
|
21.9
|
|
|
255
|
22.9
|
|
|
252
|
missing
|
|
|
102
|
Broken
|
Sample sheet for MIBA
Sample vial
|
What
|
MIBA-US-01._-
|
Leave 1
|
MIBA-US-01.__-
|
Leave 2
|
MIBA-US-01. ___149_
|
Grass 1
|
MIBA-US-01. __150
|
Grass 2
|
MIBA-US-01. _-
|
Surface Litter
|
MIBA-US-01. _151_
|
Soil in 10 cm
|
MIBA-US-01. _152
|
Stem 1
|
MIBA-US-01. _153_
|
Stem 2
|
|
Field Data
No tank data
No TZ Well data found
No TZ Moisture Point data found
No VR Moisture Point data found
No TZ grass heigth found
No VR grass heigth found
No TZ Tree DBH found
No water potential data found
No TZ Grass Biomass data found
No TZ OakLeaves Biomass data found
No TZ PineNeedles Biomass data found
0 photos found
16 sets found
No data found for TZ_Fenergy.
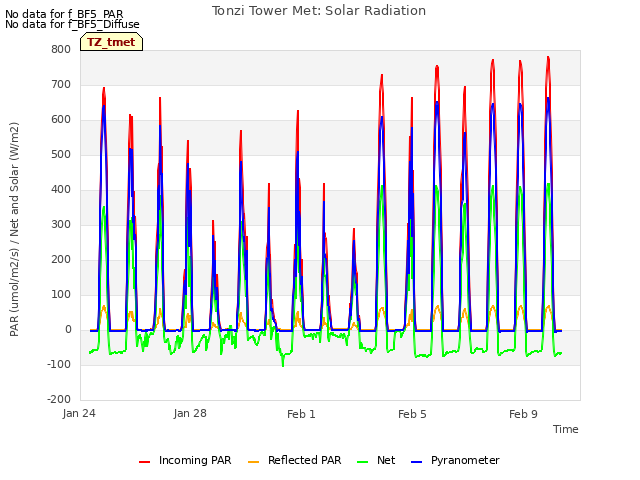
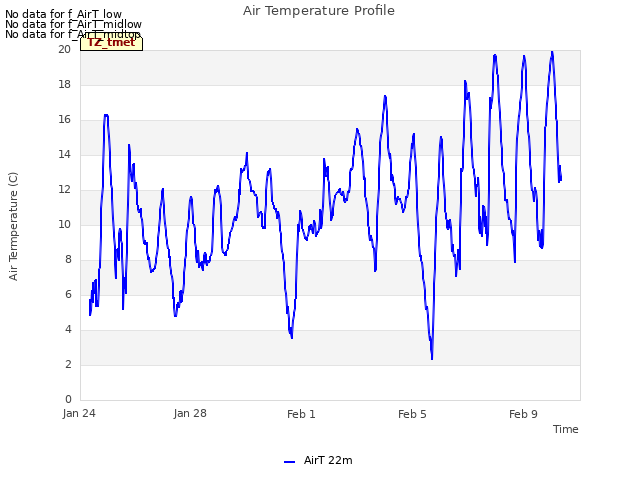
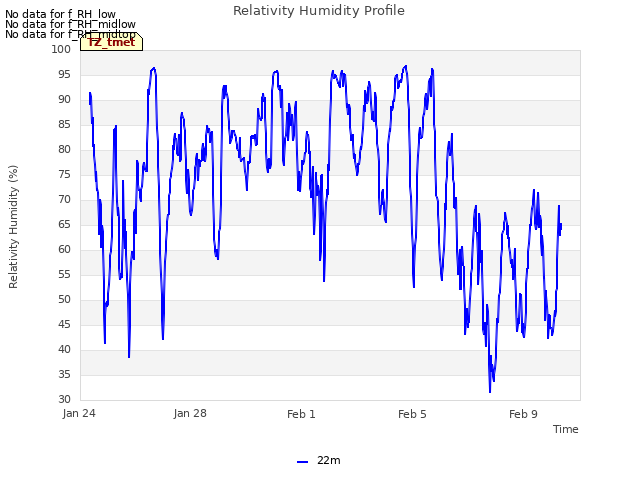
11 TZ_tmet graphs found


No data found for TZ_soilco2.
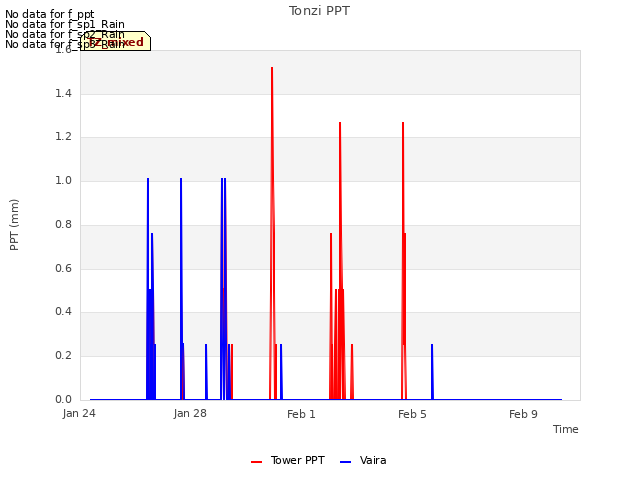
Can't check TZ_mixed
3 TZ_mixed graphs found

No data found for TZ_fflux.
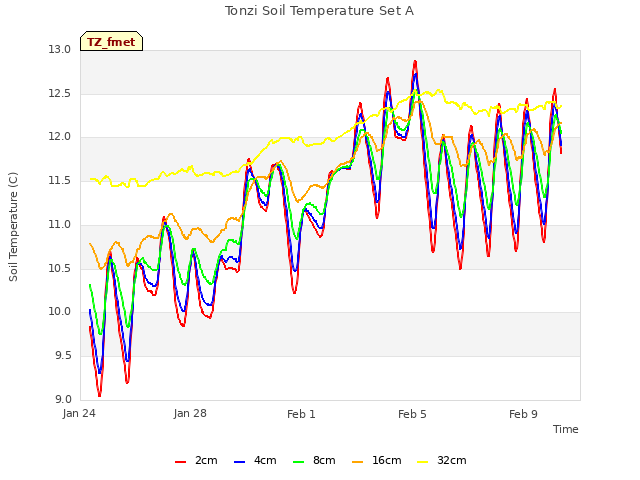
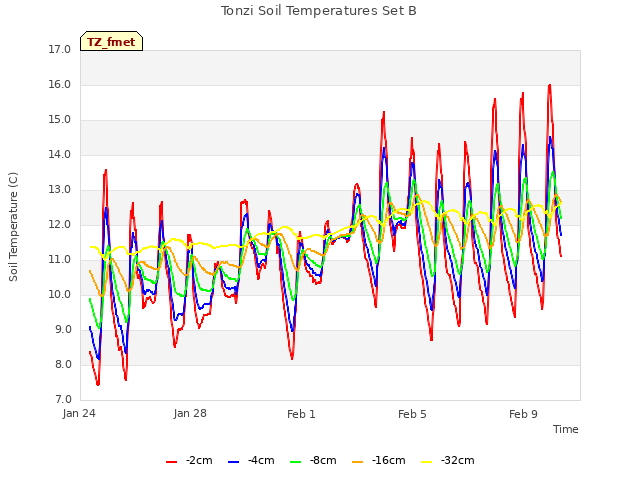
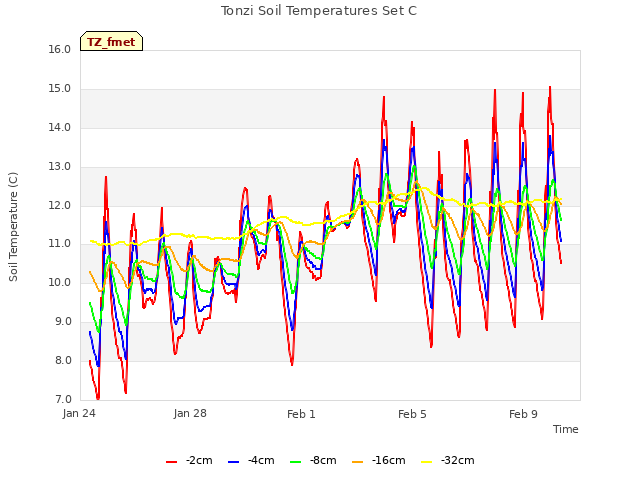
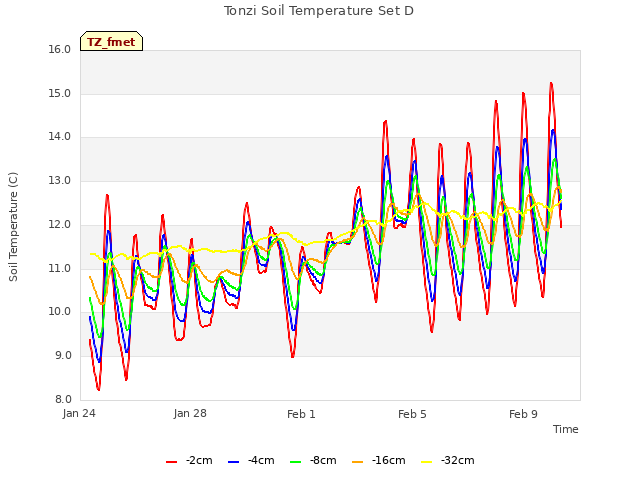
8 TZ_fmet graphs found


No data found for TZ_tram.
No data found for TZ_co2prof.
No data found for TZ_irt.
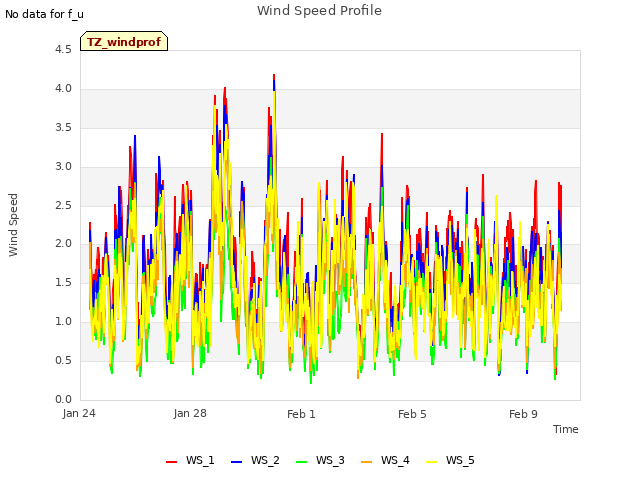
1 TZ_windprof graphs found
No data found for TZ_tflux.
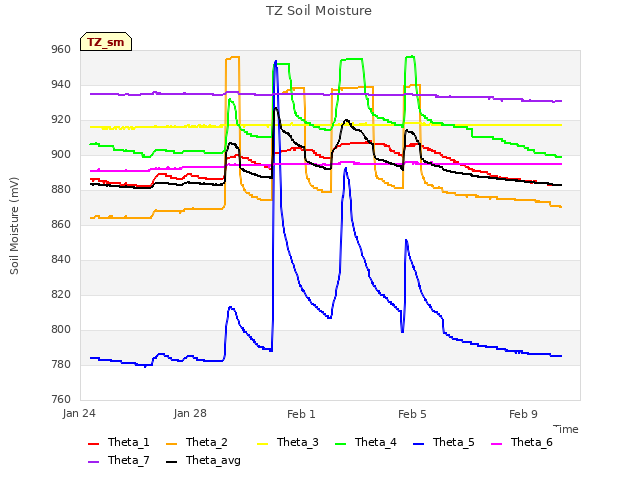
2 TZ_sm graphs found

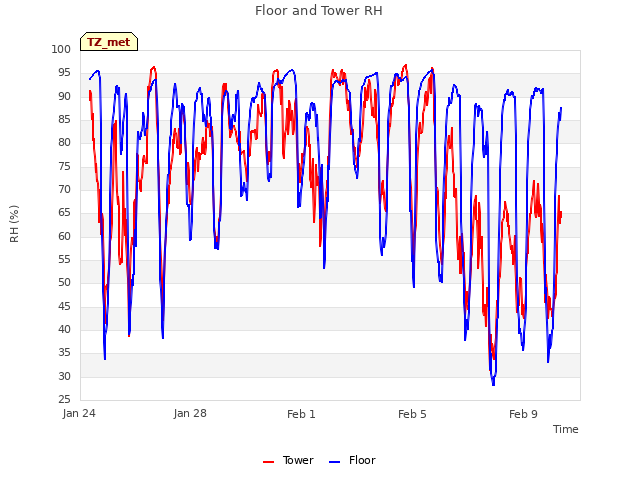
Can't check TZ_met
1 TZ_met graphs found
Can't check TZVR_mixed
No data found for TZ_osu.
No data found for TZ_fd.
Tonzi Z-cam data


