Field Notes
<--2007-11-20 00:00:00 |
2007-12-21 00:00:00-->
Phenocam link:
Searching...Tonzi: 2007-11-29 10:00:00 (DOY 333)
Author: Siyan Ma
Others: Rodrigo
When: Date: 11/29/2007 ,
Day: 333 ,
Watch Time: 10:00 .
Where: Tonzi/Vaira Ranch
Who: Siyan and Rodrigo
Weather:
clear, nice cold
Phenology:
Vaira grass almost covered 100% area, but standing litters were still thick. Overall, the grassland is in yellow. Tonzi’s grass covered about 70%. Some blue oak’s leaves were still green.
Summary
- EC system at Tower and Vaira
were working well. Floor computer
didn’t reboot properly in the morning on Day 325. So, flux data were lost between Day 325-333. Ted reported low power problem after his
last visit. Maybe we have to add
two more batteries at Floor site to solve the winter power problem. Met data are good.
- Voltage meter of Vaira fence looks broken because the pointer was
always on the far right side even though the switch was off.
- CO2 Tank was low, around 200 psig.
- Grass samples were collected
for LAI and phenology in Tower and Vaira, oak leaves sample for N.
- Dendrometer – tree stem
enlarged 3mm since Nov. 07, 2007.
- Plan to take spectrum
measurement, but forget charging laptop’s battery. Sorry!
- Rodrigo helped to do soil TDR
measurement and found that same readings for time delay but reported
different soil moisture values.
Matteo noticed the problem at Shieman
Island, too.
Vaira_Grass
Site
- Fence and gate power: >12 v.
- Panel and Batteries: 13.3 v; 0.0 amps; 4.7 amps.
- Reading from Gillsonic screen
before downloading data. (The value
of H2O and CO2 should be in the range of 0 – 5 v.)
Time
|
|
Path/File name
|
D:\Data\V07_ 333 .flx
D:\Data\VR07 .raw
|
|
mean
|
std
|
|
mean
|
std
|
w
|
0.18
|
0.238
|
Ts
|
13.9
|
0.354
|
u
|
0.91
|
0.360
|
H2O
|
1.8
|
0.030
|
v
|
-0.25
|
0.326
|
CO2
|
2.14
|
0.020
|
|
|
|
Tc
|
1.001
|
0.057
|
- downloading data – Yes.
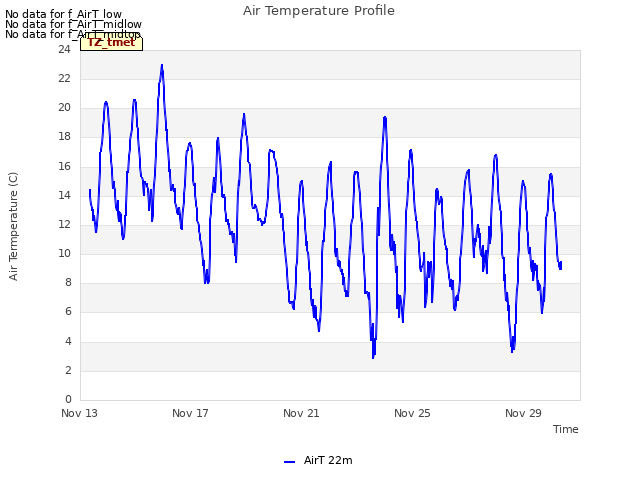
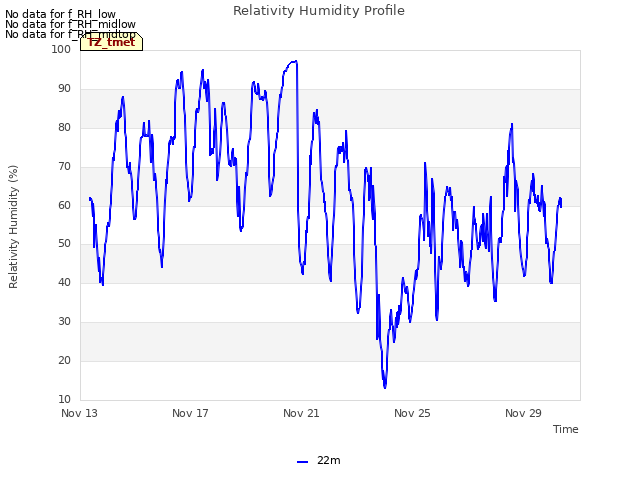
- check the fans of air temp.
and relative humidity sensors at Vaira. OK.
- Check MD-9 system connections.
OK.
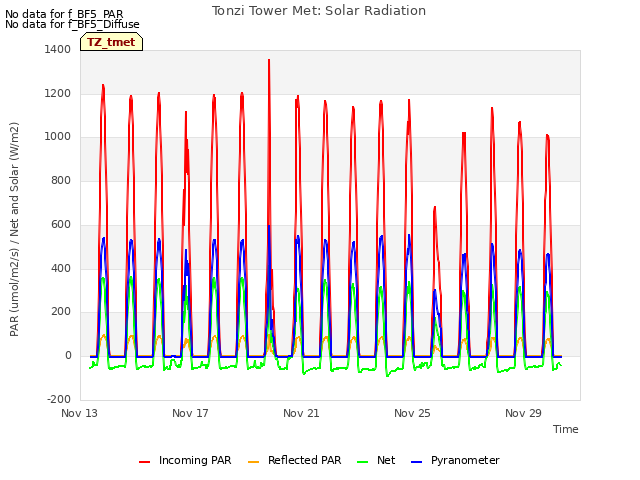
- Check levels of Radiation
sensors, clear up surfaces. Yes.
- Closed gate and set up fence.
- Voltage meter of Vaira fence
looks broken because the pointer was always on the far right side even
though the switch was off.
Tonzi_Tower Site
- Fence and gate power: Gate
was open! v.
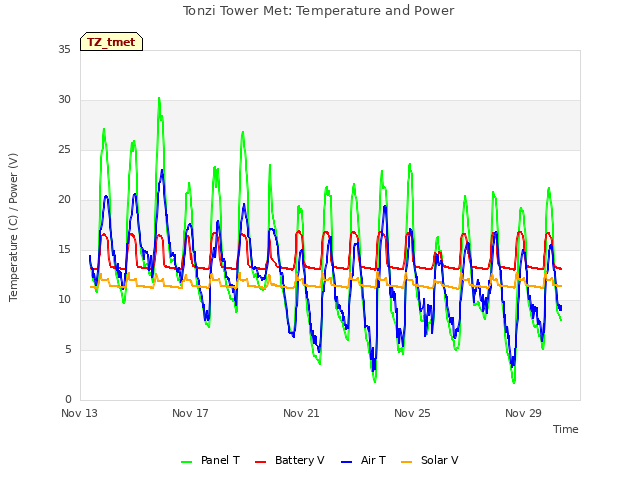
- Panel and Batteries: 13.9 v; 15.1
amps; 2.9
amps.
- Reading from Gillsonic screen
before downloading data. (The value
of H2O and CO2 should be in the range of 0 – 5 v.)
Time
|
|
Path/File name
|
D:\Data\T07_
333 .flx
D:\Data\TW07 .raw
|
|
mean
|
std
|
|
mean
|
std
|
w
|
|
|
Ts
|
|
|
u
|
|
|
H2O
|
|
|
v
|
|
|
CO2
|
|
|
- downloading data Yes.
- check the fans of air temp.
and relative humidity sensors on the tower and the floor.
- Check calibration cylinders;
CO2 200
psig; flow 20 psi.
N 2 700
psig; flow 20 psi.
Manually calibrate Li-800. Following Ted’s instruction: H:\IoneSavanna_2004\Tower_2004\CO2Profile\LI800_Calibration_Procedure_2Nov04.txt
Is the pump running Yes.
How to check the CO2 values
Click “Ports/Flags” button to see which ports or flags is setting
high. Pressure should be less than
ambient value. When Flag 8 is high, it
may indicate that RRR’s battery is low.
- close gate and set up fence. Yes.
Toniz_Floor
Site
- Fence and gate power: >12 v.
- Panel and Batteries: 13.6 v; 14.4 amps; 2.3 amps.
- Reading from Gillsonic screen
before downloading data. (The value
of H2O and CO2 should be in the range of 0 – 5 v.)
Time
|
|
Path/File name
|
D:\Data\F07_ 333 .flx
D:\Data\FL07 .raw
|
|
mean
|
std
|
|
mean
|
std
|
w
|
-0.01
|
0.272
|
Ts
|
13.79
|
0.852
|
u
|
1.67
|
1.65
|
H2O
|
2.45
|
0.126
|
v
|
0.47
|
0.765
|
CO2
|
1.69
|
0.081
|
- downloading data. Yes.
- Check MD-9 system connections. GOOD.
CR23X3 – floor-Met
CR23X5 – soil CO 2
profile
CR23X6 – tower-Met
CR10X2 – floor-Met
CR10X4 – sap-flow
CR10X7 – CO 2 profile
CR10X8 – wind profile
- Soil CO2 profile:
in the lab
- Close gate and set up fence.
Yes.
tonzi
|
7931AFE
|
402165
|
574B4B
|
402FF3
|
574632
|
7A432E
|
7A3C6E
|
7A3B40
|
7A4AAA
|
29-Nov-07
|
333
|
|
|
|
|
|
|
|
|
|
SM
|
|
|
|
|
|
|
|
|
0-15
|
9.8
|
7.9
|
25.6
|
13.2
|
11.6
|
11.2
|
14.5
|
5.9
|
7.8
|
15-30
|
13.2
|
14.3
|
16.2
|
17.1
|
13.5
|
9.2
|
17.4
|
14.2
|
4.4
|
30-45
|
17.5
|
7.1
|
5.4
|
14.2
|
1.7
|
8.8
|
13.2
|
16.5
|
13.0
|
45-60
|
11.7
|
3.6
|
8.5
|
8.7
|
15.1
|
10.5
|
11.3
|
15.4
|
9.6
|
|
|
|
|
|
|
|
|
|
|
|
A6D882B
|
A3D04E8
|
A6D72F5
|
|
|
|
|
|
|
|
|
|
|
|
|
|
|
|
|
0-15
|
21.1
|
16.5
|
6.3
|
|
|
|
|
|
|
15-30
|
11.8
|
10.3
|
14.9
|
|
|
|
|
|
|
30-45
|
14.3
|
16.2
|
12.2
|
|
|
|
|
|
|
45-60
|
13.0
|
5.5
|
2.6
|
|
|
|
|
|
|
|
|
|
|
|
|
|
|
|
|
vaira
|
57318a
|
7933dee
|
|
|
|
|
|
|
|
0-15
|
2.2
|
5.5
|
|
|
|
|
|
|
|
15-30
|
9.7
|
13.6
|
|
|
|
|
|
|
|
30-45
|
8.9
|
11.9
|
|
|
|
|
|
|
|
45-60
|
14.9
|
15.3
|
|
|
|
|
|
|
|
Tonzi
|
|
|
|
Dendrometer
|
|
|
|
|
|
|
Date
|
Day
|
Tag #
|
Reading (cm)
|
11/29/2007
|
333
|
71
|
Broken
|
|
|
72
|
4.2
|
|
|
77
|
Broken
|
|
|
78
|
Broken
|
|
|
79
|
8.1
|
|
|
245
|
-0.1
|
|
|
248
|
9.7
|
|
|
250
|
7.4
|
|
|
255
|
Broken
|
|
|
252
|
missing
|
|
|
102
|
4.0
|
|
Field Data
No tank data
No TZ Well data found
No TZ Moisture Point data found
No VR Moisture Point data found
No TZ grass heigth found
No VR grass heigth found
No TZ Tree DBH found
No water potential data found
No TZ Grass Biomass data found
No TZ OakLeaves Biomass data found
No TZ PineNeedles Biomass data found
0 photos found
16 sets found
No data found for TZ_Fenergy.
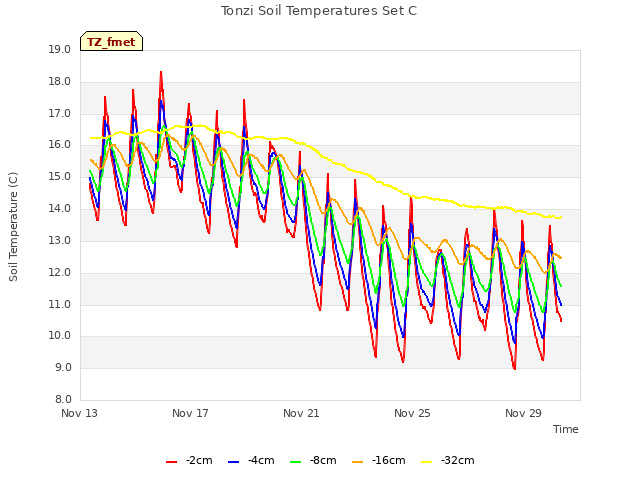
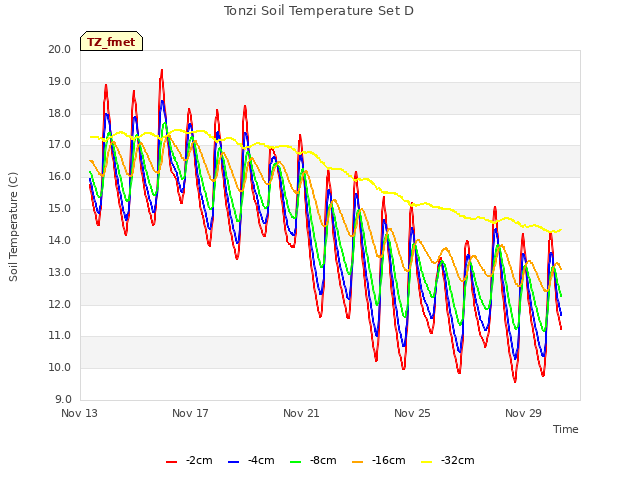
11 TZ_tmet graphs found


No data found for TZ_soilco2.
Can't check TZ_mixed
3 TZ_mixed graphs found

No data found for TZ_fflux.
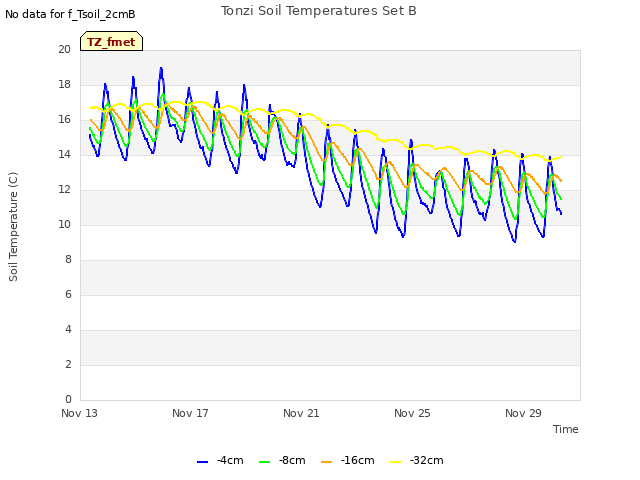
8 TZ_fmet graphs found


No data found for TZ_tram.
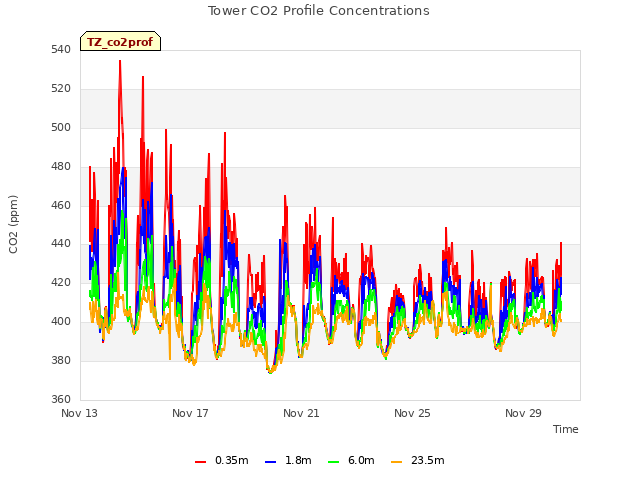
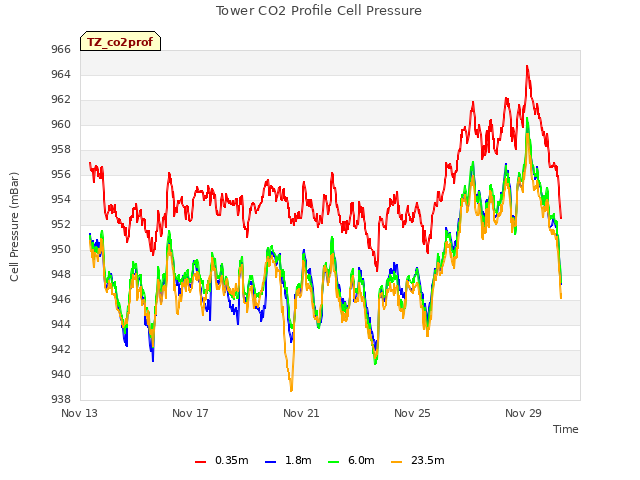
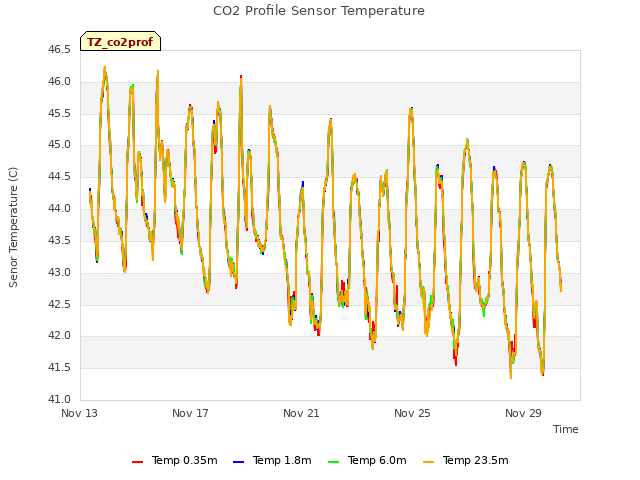
3 TZ_co2prof graphs found
No data found for TZ_irt.
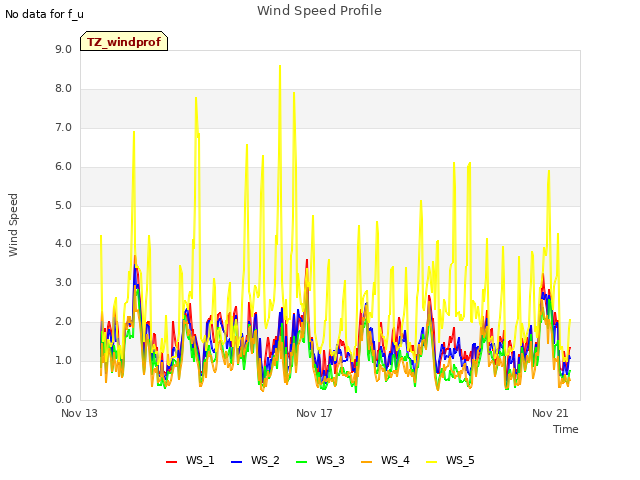
1 TZ_windprof graphs found
No data found for TZ_tflux.
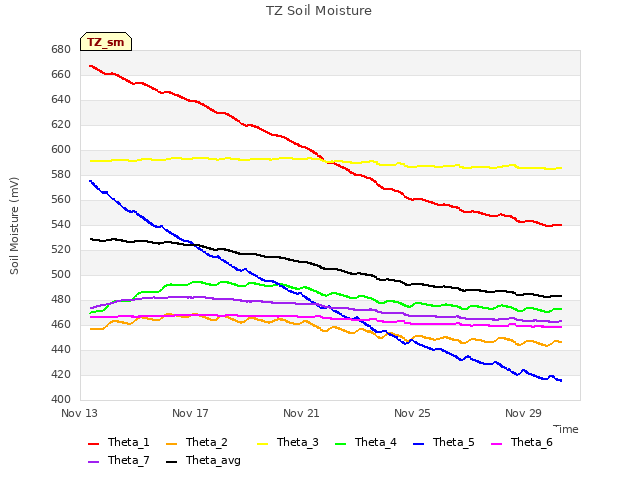
2 TZ_sm graphs found

Can't check TZ_met
1 TZ_met graphs found
Can't check TZVR_mixed
No data found for TZ_osu.
No data found for TZ_fd.
Tonzi Z-cam data


