Field Notes
<--2007-10-24 10:30:00 |
2007-11-20 00:00:00-->
Phenocam link:
Searching...Tonzi: 2007-11-07 10:15:00 (DOY 311)
Author: Siyan Ma
Others:
When: Date: 11/07/2007 ,
Day: 311 ,
Watch Time: 10:15am .
Where: Tonzi/Vaira Ranch
Who: Siyan
Weather:
clear, hot
Phenology:
The sites still looked yellow overall.
Young grasses that germinated under litters got dry again. No new germination yet. Some big oak trees (e.g. Liukang’s tree)
produced acorns this year, and their leaves were still green. Collected some acorns under Liukang’s tree
(#92) and around Tree #11.
Summary
- CO2 tank is very low (~400 psi).
- Three towers worked
well.
- RRR parked 1 m away from the other
end of charge-station. I followed
Ted’s instruction, disconnected battery and took the whole cart back to
the lab.
- Sampled senescent oak leaves
for Stefania’s nitrogen resoption testing.
- Took spectrometer measurement
at Vaira and Tonzi.
- Took TDR probe measurement.
Vaira_Grass
Site
- Fence and gate power: 12
v.
- Panel and Batteries: 13.8
v; 13.7 amps; 1.7
amps.
- Reading from Gillsonic screen
before downloading data. (The value
of H2O and CO2 should be in the range of 0 – 5 v.)
Time
|
|
Path/File name
|
D:\Data\V07_ 311
.flx
D:\Data\VR07 .raw
|
|
mean
|
std
|
|
mean
|
std
|
w
|
0.15
|
0.22
|
Ts
|
21.8
|
0.72
|
u
|
0.30
|
0.21
|
H2O
|
1.84
|
0.026
|
v
|
0.97
|
0.71
|
CO2
|
1.88
|
0.027
|
|
|
|
Tc
|
2.09
|
0.112
|
- I did not downloaded data because
I forgot bring the memory drive.
- check the fans of air temp.
and relative humidity sensors at Vaira. OK.
- Check MD-9 system connections.
OK.
- Closed gate and set up fence. Yes.
Tonzi_Tower Site
- Fence and gate power: >12 v.
- Panel and Batteries: 13.3
v; 0.0 amps; 4.1
amps.
- Reading from Gillsonic screen
before downloading data. (The value
of H2O and CO2 should be in the range of 0 – 5 v.)
Time
|
|
Path/File name
|
D:\Data\T07_ 311 .flx
D:\Data\TW07
.raw
|
|
mean
|
std
|
|
mean
|
std
|
w
|
0.35
|
0.4
|
Ts
|
23.1
|
0.45
|
u
|
0.78
|
0.6
|
H2O
|
2.07
|
0.01
|
v
|
1.7
|
0.5
|
CO2
|
1.056
|
0.017
|
- downloading data (Not)
- check the fans of air temp.
and relative humidity sensors on the tower and the floor.
- Check calibration cylinders;
CO 2 500 psig; flow 20
psi.
N 2 1000
psig; flow 20 psi.
Manually calibrate Li-800. Following Ted’s instruction: H:\IoneSavanna_2004\Tower_2004\CO2Profile\LI800_Calibration_Procedure_2Nov04.txt
Is the pump running Yes
- CR10X7 – CO2
profile
394.3
|
394.9
|
395.3
|
395.3
|
948.7
|
942.5
|
943.3
|
942.8
|
45.0
|
45.1
|
45.1
|
45.2
|
49.7
|
49.8
|
49.8
|
49.7
|
-3.48
|
421.5
|
948.5
|
946
|
43.8
|
43.4
|
49.4
|
49.4
|
How to check the CO2 values
Click “Ports/Flags” button to see which ports or flags is setting
high. Pressure should be less than
ambient value. When Flag 8 is high, it
may indicate that RRR’s battery is low.
- close gate and set up fence. OK.
Toniz_Floor
Site
- Fence and gate power: 12
v.
- Panel and Batteries: 13.5
v; 9.0 amps; 2.0
amps.
- Reading from Gillsonic screen
before downloading data. (The value
of H2O and CO2 should be in the range of 0 – 5 v.)
Time
|
|
Path/File name
|
D:\Data\F07_ 311 .flx
D:\Data\FL07 .raw
|
|
mean
|
std
|
|
mean
|
std
|
w
|
0.2
|
0.324
|
Ts
|
23.45
|
0.213
|
u
|
-0.75
|
0.275
|
H2O
|
2.2
|
0.088
|
v
|
0.95
|
0.502
|
CO2
|
1.7
|
0.025
|
- Check MD-9 system connections. OK.
- Soil CO2 profile: probes are in the lab for calibration.
- Close gate and set up fence. Yes.
Soil Moisture
|
|
|
|
|
|
|
|
|
|
vaira
|
57318a
|
|
|
|
7933dee
|
|
|
|
|
0-15
|
3.9
|
3.6
|
3.9
|
|
8.8
|
9.7
|
9.4
|
|
|
15-30
|
5.1
|
4.8
|
5.4
|
|
6.9
|
7.2
|
6.6
|
|
|
30-45
|
10.1
|
10.1
|
10.1
|
|
11.5
|
11.5
|
11.5
|
|
|
45-60
|
12.5
|
12.8
|
12.2
|
|
16.8
|
15.3
|
15.3
|
|
|
|
|
|
|
|
|
|
|
|
|
- Close gate and set up fence.
Tonzi
|
|
|
|
Dendrometer
|
|
|
|
|
|
|
Date
|
Day
|
Tag #
|
Reading (cm)
|
11/07/2007
|
311
|
71
|
Broken
|
|
|
72
|
1.9
|
|
|
77
|
Broken
|
|
|
78
|
Broken
|
|
|
79
|
6.2
|
|
|
245
|
3.8
|
|
|
248
|
|
|
|
250
|
4.0
|
|
|
255
|
|
|
|
252
|
Missing
|
|
|
102
|
3.8
|
|
Field Data
No tank data
No TZ Well data found
No TZ Moisture Point data found
No VR Moisture Point data found
No TZ grass heigth found
No VR grass heigth found
No TZ Tree DBH found
No water potential data found
No TZ Grass Biomass data found
No TZ OakLeaves Biomass data found
No TZ PineNeedles Biomass data found
0 photos found
16 sets found
No data found for TZ_Fenergy.
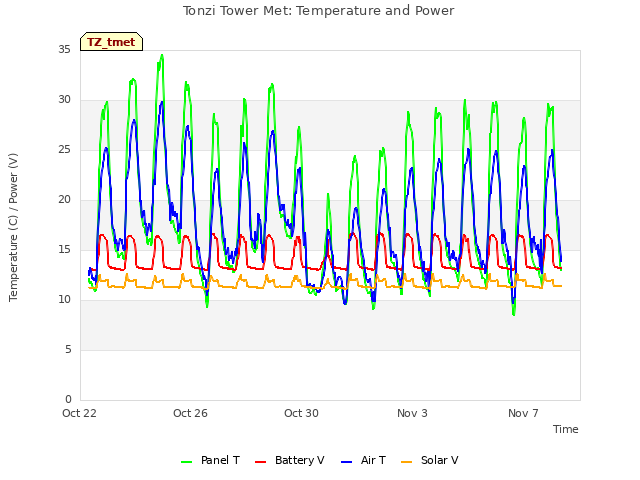
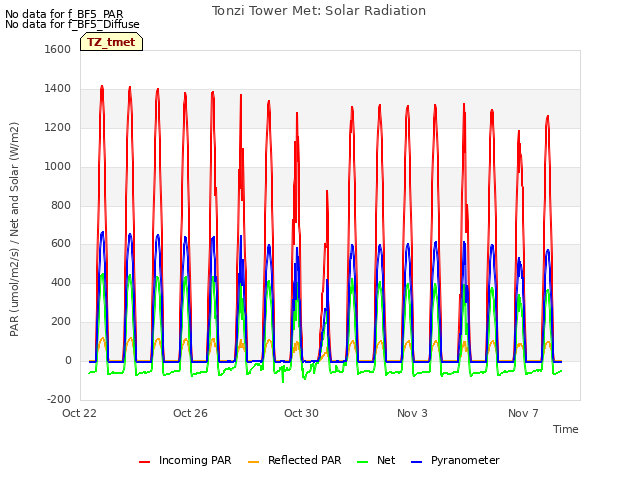
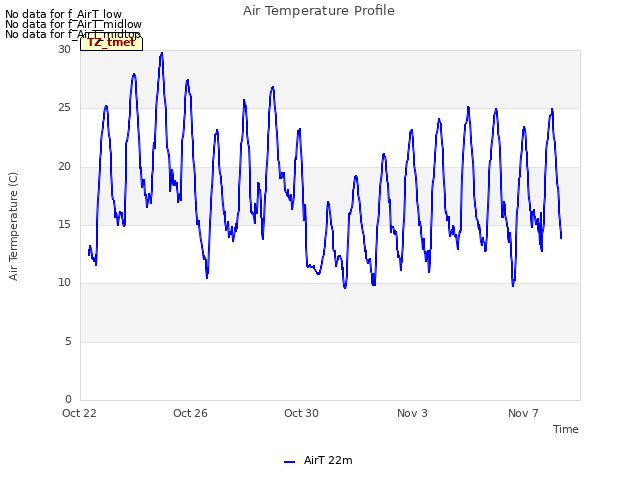
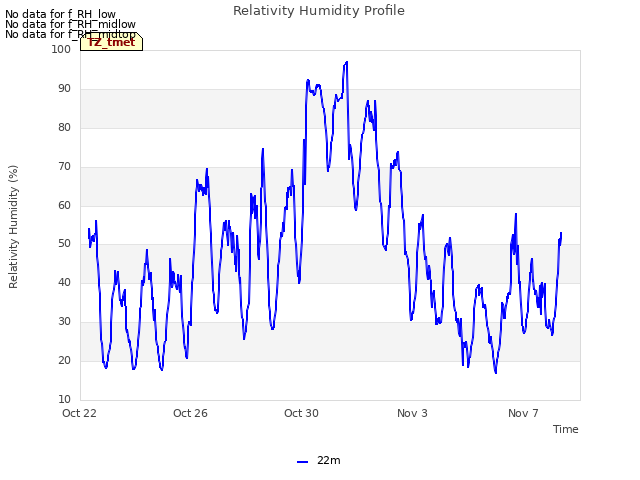
11 TZ_tmet graphs found


No data found for TZ_soilco2.
Can't check TZ_mixed
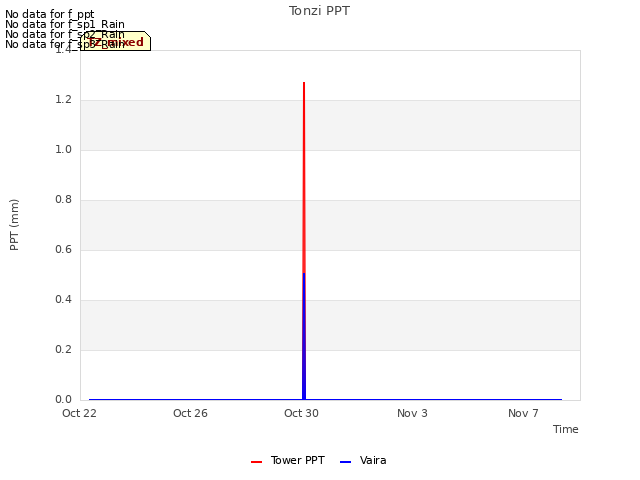
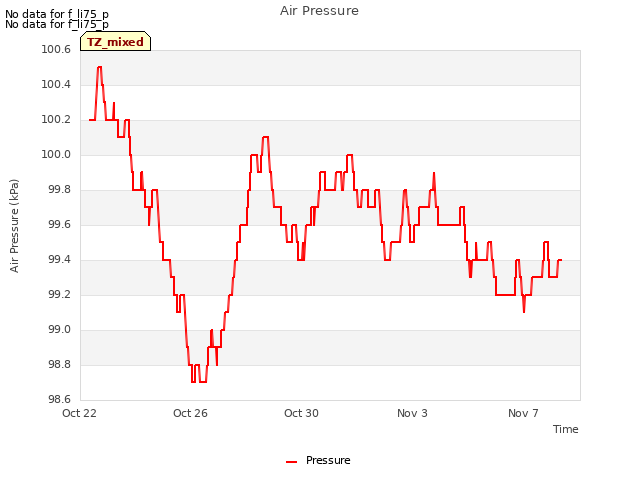
3 TZ_mixed graphs found

No data found for TZ_fflux.
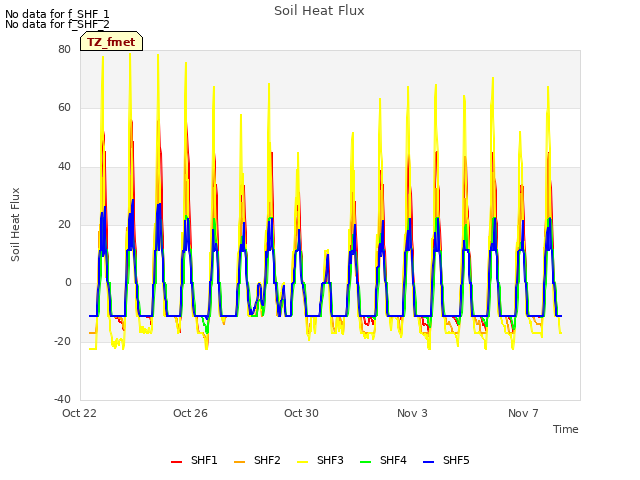
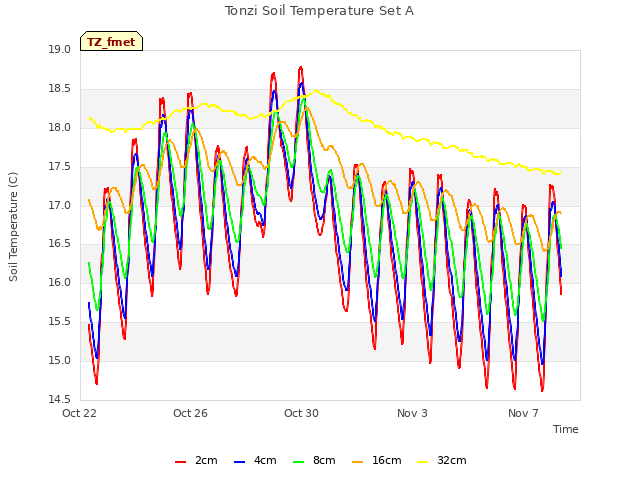
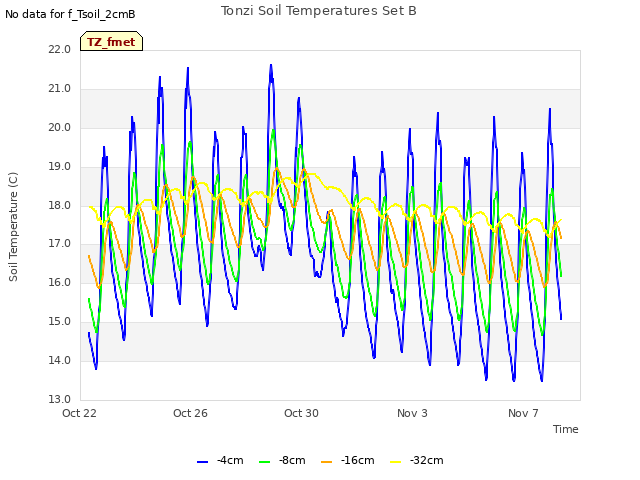
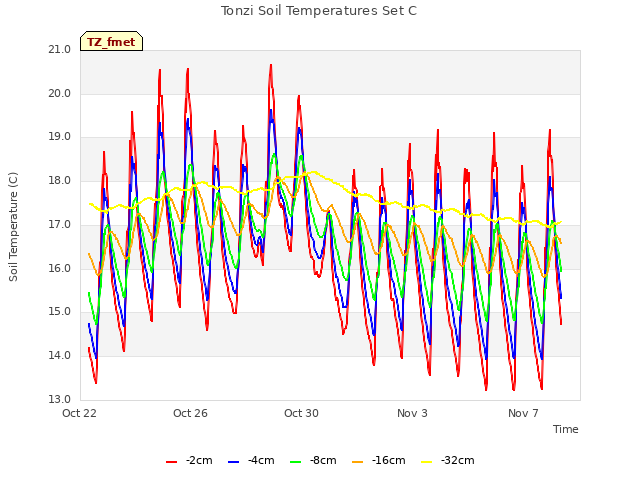
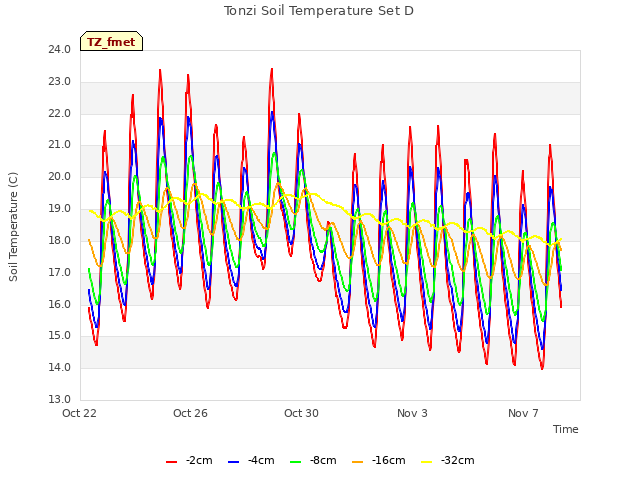
8 TZ_fmet graphs found


No data found for TZ_tram.
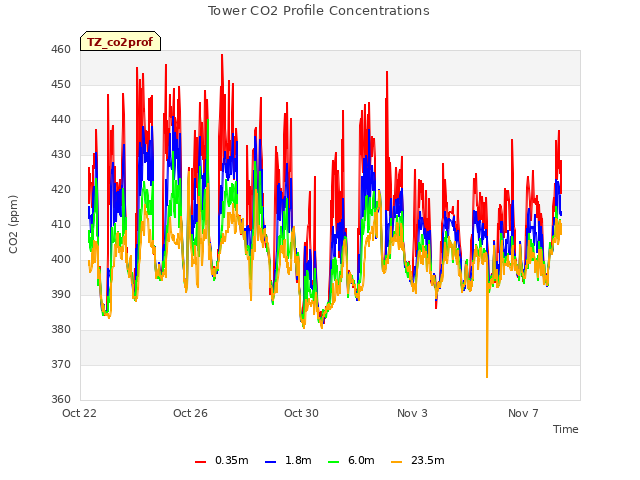
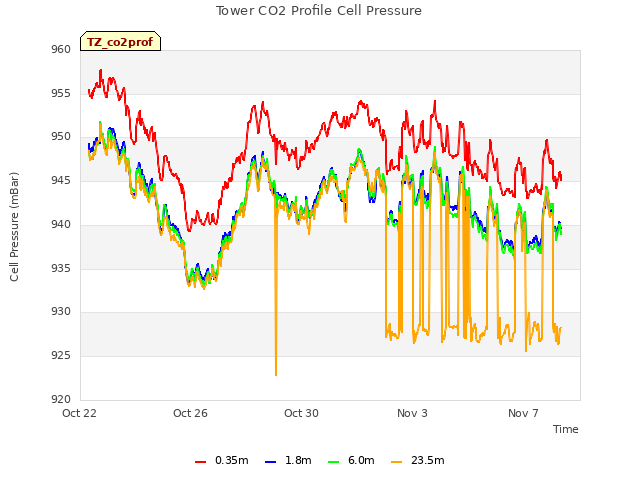
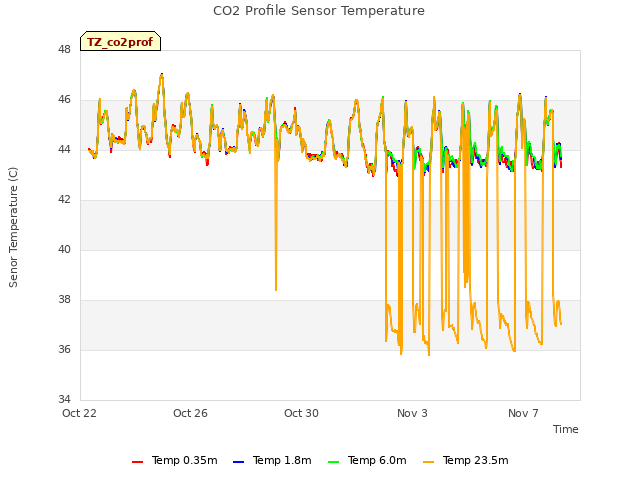
3 TZ_co2prof graphs found
No data found for TZ_irt.
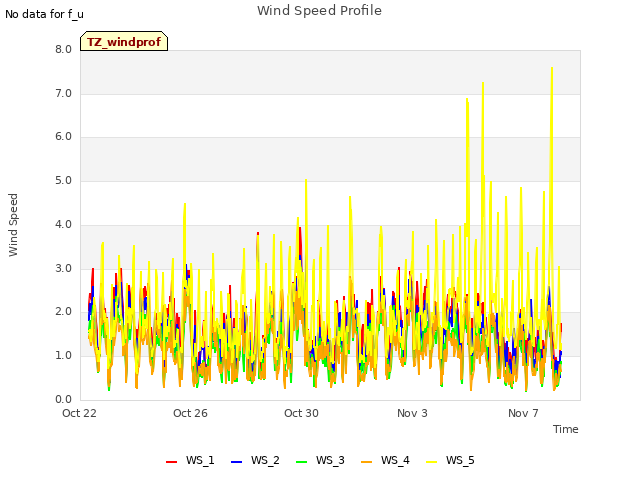
1 TZ_windprof graphs found
No data found for TZ_tflux.
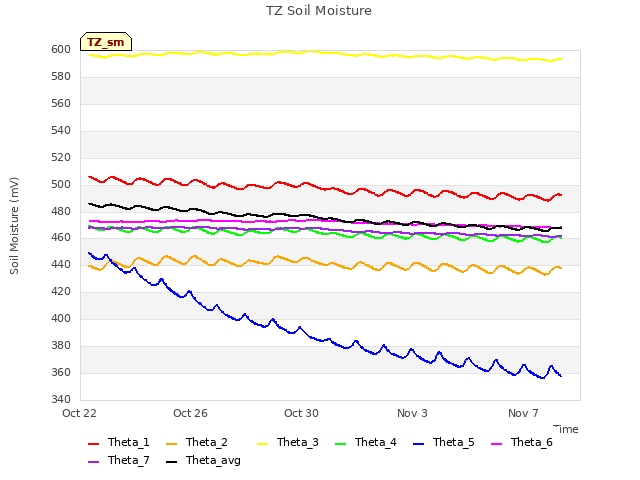
2 TZ_sm graphs found

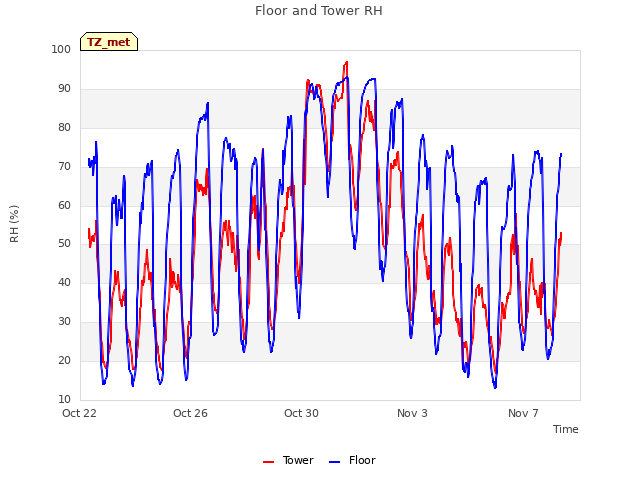
Can't check TZ_met
1 TZ_met graphs found
Can't check TZVR_mixed
No data found for TZ_osu.
No data found for TZ_fd.
Tonzi Z-cam data


