Field Notes
<--2007-03-14 10:27:00 |
2007-04-05 09:30:00-->
Phenocam link:
Searching...Tonzi: 2007-03-28 09:30:00 (DOY 87)
Author: Siyan Ma
Others: Xingyuan, Youngryel
When: Date: 3/28/2007 , Day: 87
, Watch Time: 9:30am .
Where: Tonzi/Vaira Ranch
Who: Siyan, Xingyuan, and Youngyrle
Weather:
clear, chilly, windy,
Phenology:
oak tree leaves come out, 90%. Xingyuan
said that tree leaves start coming out on the Monday of last week and more last
Sunday. Grasses grew a lot during the
past two weeks. Vaira’s grass start
seeding, 20%.
Summary
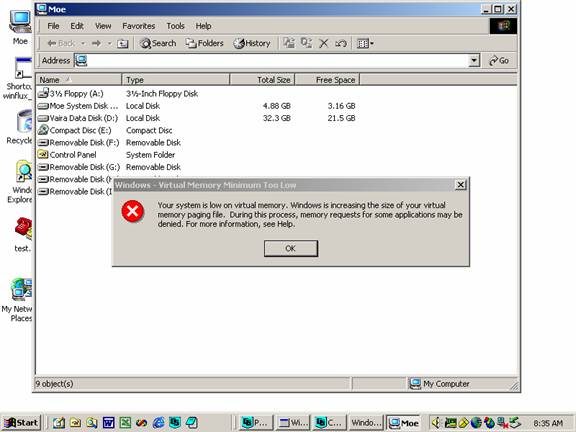
- EC systems worked well at the three sites and data are downloaded,
but see a error message window at Vaira site.
- swap Li-7500 at Vaira and Tonzi
Tower,
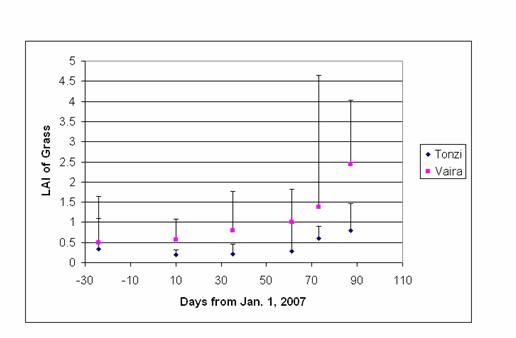
- grass sample for LAI and
phenology in Tower and Vaira, oak branches for N
- measure soil moisture
- most of dendrometers are
out of range. Should we replace
them
- Youngyrle took care of
measurements of spectrometer
- Xingyuan went to Tonzi for
setting up sapflow measurements.
Vaira_Grass
Site
- Fence and gate power: >12.0 v.
- Panel and Batteries: 14.0 v; 14.9 amps; 3.2 amps.
- Reading from Gillsonic screen
before downloading data. (The value
of H2O and CO2 should be in the range of 0 – 5 v.)
Time
|
8:39:37
|
Path/File name
|
D:\Data\V07_ 087
.flx
D:\Data\VR070870830 .raw
|
|
mean
|
std
|
|
mean
|
std
|
w
|
0.58
|
0.685
|
Ts
|
14.2
|
0.385
|
u
|
3.28
|
0.395
|
H2O
|
0.000
|
0.161
|
v
|
0.43
|
1.65
|
CO2
|
1.924
|
0.081
|
|
|
|
Tc
|
1.023
|
0.023
|
- downloading data, OK. See this window:
- swaping Li-7500
Analyzer. (Remove SN# 73 ; install SN# 65 )
- check the fans of air temp.
and relative humidity sensors at Vaira. OK
- Check MD-9 system connections
OK
- Check levels of Radiation
sensors, clear up surfaces. Done
9. Closed gate and
set up fence.Yes
Tonzi_Tower Site
- Fence and gate power: 12.0 v.
- Panel and Batteries: 14.0 v; 0.0 amps; 5.0 amps.
- Reading from Gillsonic screen
before downloading data. (The value
of H2O and CO2 should be in the range of 0 – 5 v.)
Time
|
|
Path/File name
|
D:\Data\T07_
.flx
D:\Data\TW07 .raw
|
|
mean
|
std
|
|
mean
|
std
|
w
|
1.8
|
0.95
|
Ts
|
14.9
|
0.47
|
u
|
4.7
|
1.12
|
H2O
|
1.5
|
0.030.019
|
v
|
-3.5
|
1.35
|
CO2
|
2.0
|
|
- downloading data Yes
- swaping Li-7500
Analyzer. (Remove SN# 976 ; install SN# 41 )
- check the fans of air temp.
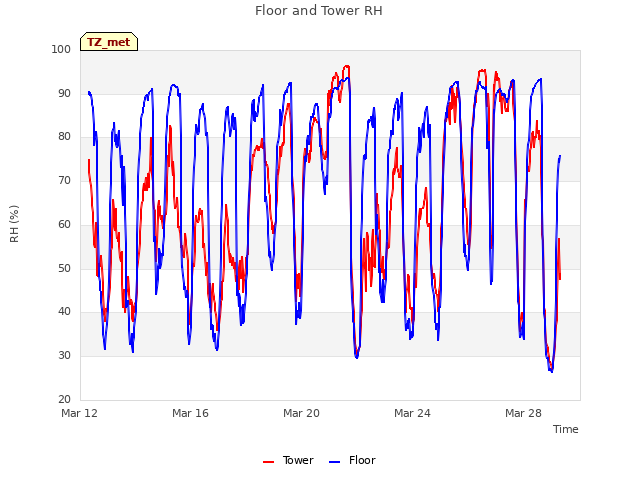
and relative humidity sensors on the tower and the floor. OK
- Check calibration cylinders;
CO 2 1300
psig; flow 20 psi.
N 2 1100
psig; flow 20 psi.
Manually calibrate Li-800. Following Ted’s instruction: H:\IoneSavanna_2004\Tower_2004\CO2Profile\LI800_Calibration_Procedure_2Nov04.txt
Is the pump running Yes
- close gate and set up fence. Yes
Toniz_Floor
Site
- Fence and gate power: 12
v.
- Panel and Batteries: 13.8 v; 10.3 amps; 1.8 amps.
- Reading from Gillsonic screen
before downloading data. (The value
of H2O and CO2 should be in the range of 0 – 5 v.)
Time
|
|
Path/File name
|
D:\Data\F07_
.flx
D:\Data\FL067 .raw
|
|
mean
|
std
|
|
mean
|
std
|
w
|
-0.44
|
0.53
|
Ts
|
15.3
|
0.56
|
u
|
1.70
|
1.01
|
H2O
|
1.29
|
0.14
|
v
|
0.43
|
3.14
|
CO2
|
2.3
|
0.07
|
- downloading data Yes
- Check MD-9 system connections
OK
CR23X3 – floor-Met
CR23X5 – soil CO 2
profile
CR23X6 – tower-Met
CR10X2 – floor-Met
CR10X4 – sap-flow
CR10X7 – CO 2 profile
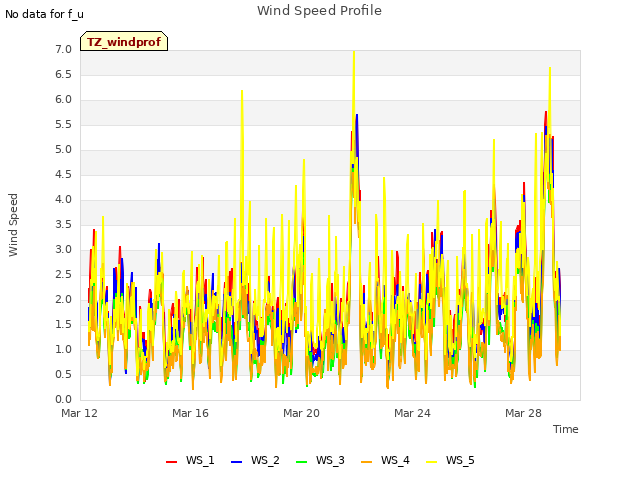
CR10X8 – wind profile
- Soil CO2 profile
Reading
from datalogger
Panel
temp
|
20.3
|
|
|
Battery
voltage
|
13.4
|
|
|
CO2E_1
|
763
|
TCE_1
|
16.4
|
CO2W_1
|
1062
|
TCW_1
|
14.7
|
CO2E_2
|
1569
|
TCE_2
|
17.4
|
CO2W_2
|
1646
|
TCW_2
|
13.4
|
CO2E_3
|
2007
|
TCE_3
|
14.0
|
CO2W_3
|
3306
|
TCW_3
|
14.1
|
CO2E_4
|
2855
|
TCE_4
|
12.4
|
CO2W_4
|
5192
|
TCW_4
|
13.7
|
Reading
from panels of analyzers
depth
|
Open
|
order
|
depth
|
Tree
|
order
|
2cm
(1%)
|
1530
|
1
|
2cm
(1%)
|
1720
|
1
|
4cm
|
3130
|
2
|
4cm
|
1.68%
|
4
|
8cm
|
4250
|
3
|
8cm
|
2580
|
2
|
16cm
|
5520
|
4
|
16cm
|
1.41%
|
3
|
- Close gate and set up fence.
tonzi
|
7931AFE
|
402165
|
574B4B
|
402FF3
|
574632
|
7A432E
|
7A3C6E
|
7A3B40
|
7A4AAA
|
28-Mar-07
|
87
|
|
|
|
|
|
|
|
|
|
SM
|
|
|
|
|
|
|
|
|
0-15
|
35.1
|
27.3
|
34.8
|
25.7
|
30.7
|
29.4
|
25.6
|
22.3
|
16.9
|
15-30
|
37.3
|
29.8
|
36.7
|
35.5
|
36.8
|
22.4
|
28.0
|
29.4
|
14.8
|
30-45
|
39.8
|
37.4
|
42.4
|
38.8
|
51.2
|
26.6
|
24.3
|
29.5
|
30.4
|
45-60
|
42.4
|
57.9
|
57.4
|
44.6
|
40.4
|
30.5
|
37.3
|
43.8
|
23.9
|
|
|
|
|
|
|
|
|
|
|
|
A6D882B
|
A3D04E8
|
A6D72F5
|
|
|
|
|
|
|
|
|
|
|
|
|
|
|
|
|
0-15
|
34.1
|
28.7
|
17.6
|
|
|
|
|
|
|
15-30
|
22.7
|
26.7
|
29.9
|
|
|
|
|
|
|
30-45
|
30.7
|
32.1
|
30.9
|
|
|
|
|
|
|
45-60
|
40.6
|
49.7
|
45.7
|
|
|
|
|
|
|
|
|
|
|
|
|
|
|
|
|
vaira
|
57318a
|
7933dee
|
|
|
|
|
|
|
|
0-15
|
12.6
|
14.4
|
|
|
|
|
|
|
|
15-30
|
18.9
|
23.2
|
|
|
|
|
|
|
|
30-45
|
22.1
|
23.1
|
|
|
|
|
|
|
|
45-60
|
24.3
|
29.3
|
|
|
|
|
|
|
|
Tonzi
|
|
|
|
Dendrometer
|
|
|
|
|
|
|
Date
|
Day
|
Tag #
|
Reading (cm)
|
3/28/2007
|
87
|
71
|
24.6
|
|
|
72
|
23.6
|
|
|
77
|
Broken
|
|
|
78
|
Broken
|
|
|
79
|
23.5
|
|
|
245
|
22.7
|
|
|
248
|
25.0
|
|
|
250
|
22.8
|
|
|
255
|
22.6
|
|
|
252
|
missing
|
|
|
102
|
Broken
|
LAI
2007
Sample sheet for MIBA
Sample vial
|
What
|
MIBA-US-01.178
|
Leave 1
|
MIBA-US-01. 179
|
Leave 2
|
MIBA-US-01. 180
|
Grass 1
|
MIBA-US-01. 181
|
Grass 2
|
MIBA-US-01. 182
|
Soil in 10 cm
|
MIBA-US-01. 183
|
Stem 1
|
MIBA-US-01. 184
|
Stem 2
|
|
Field Data
No tank data
No TZ Well data found
No TZ Moisture Point data found
No VR Moisture Point data found
No TZ grass heigth found
No VR grass heigth found
No TZ Tree DBH found
No water potential data found
No TZ Grass Biomass data found
No TZ OakLeaves Biomass data found
No TZ PineNeedles Biomass data found
0 photos found
16 sets found
No data found for TZ_Fenergy.
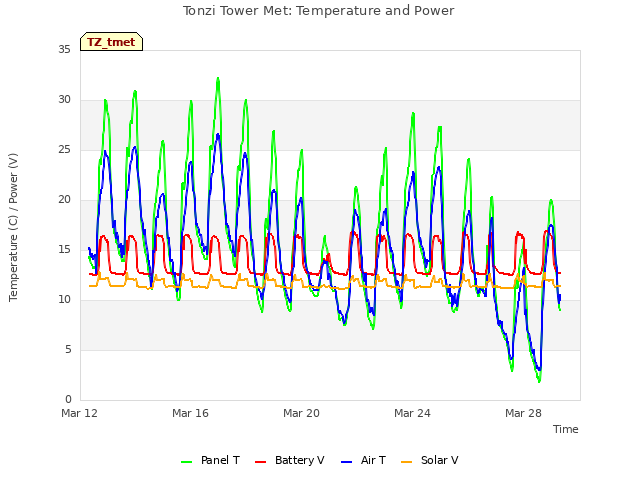
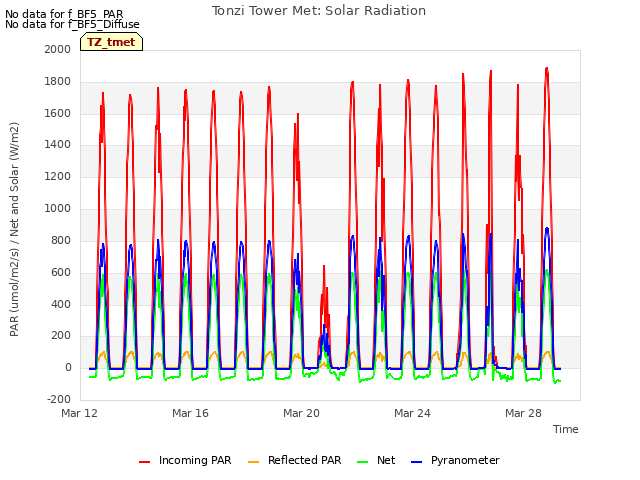
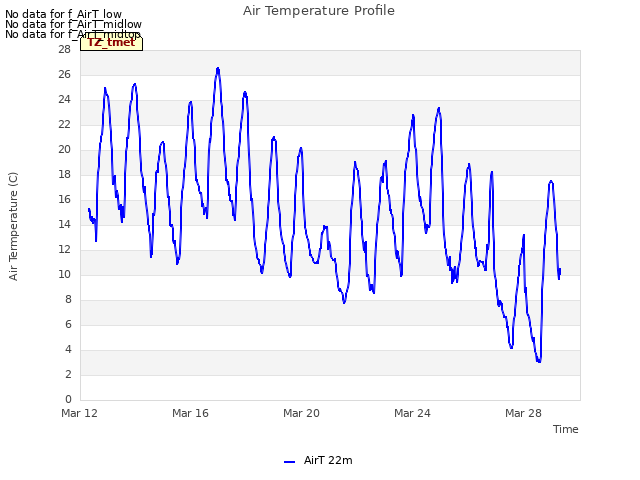
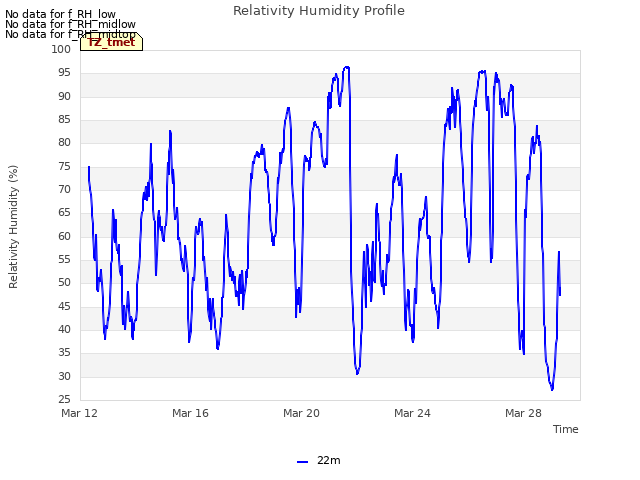
11 TZ_tmet graphs found


No data found for TZ_soilco2.
Can't check TZ_mixed
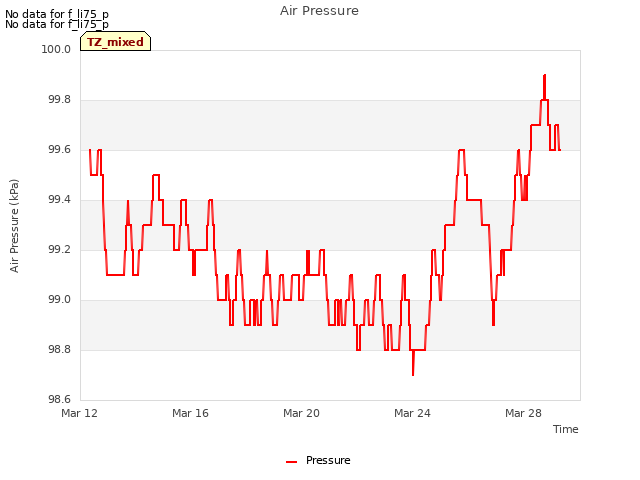
3 TZ_mixed graphs found

No data found for TZ_fflux.
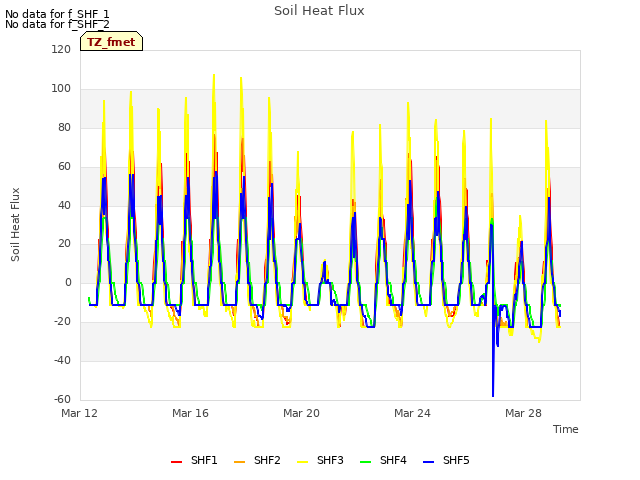
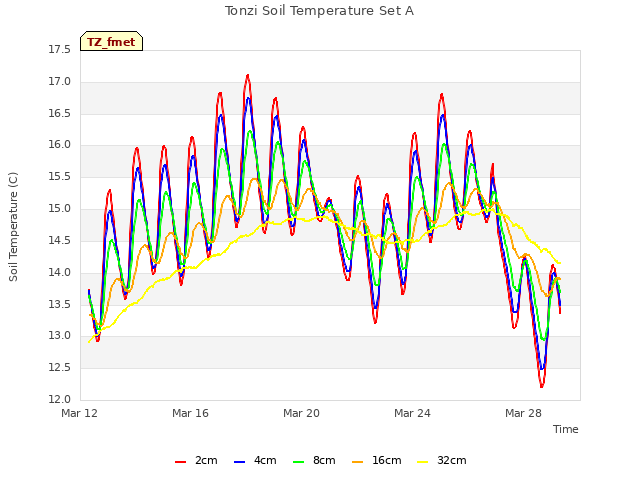
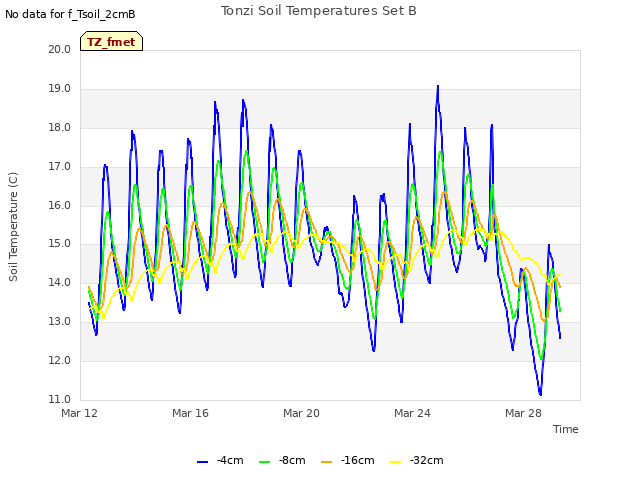
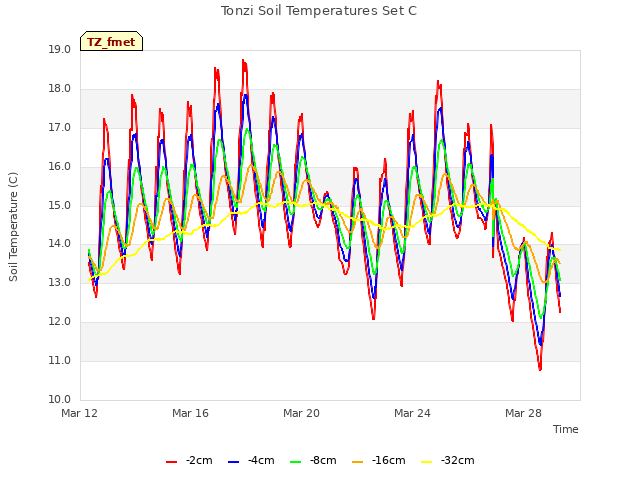
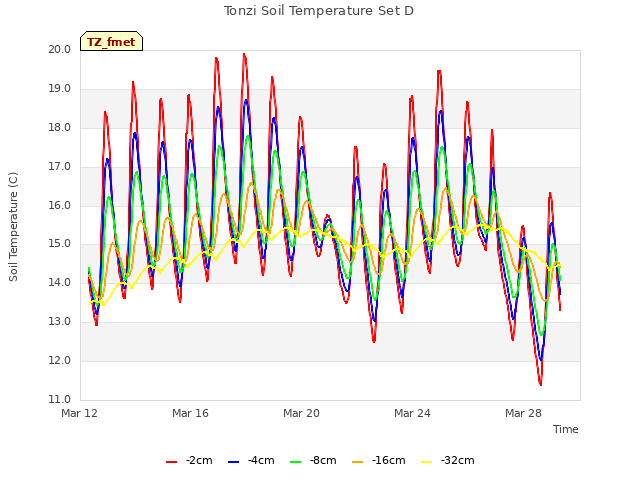
8 TZ_fmet graphs found


No data found for TZ_tram.
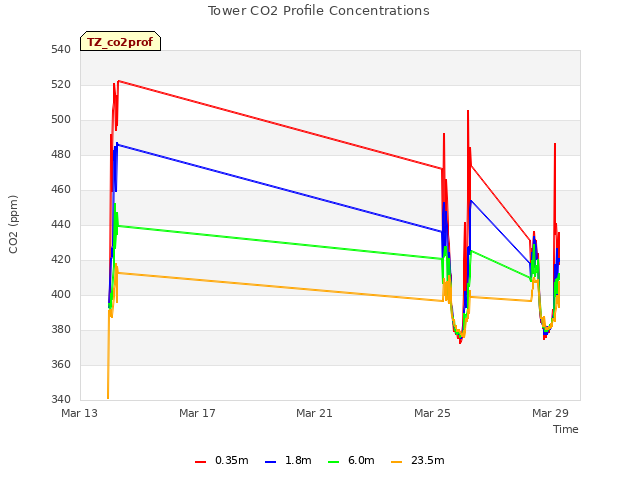
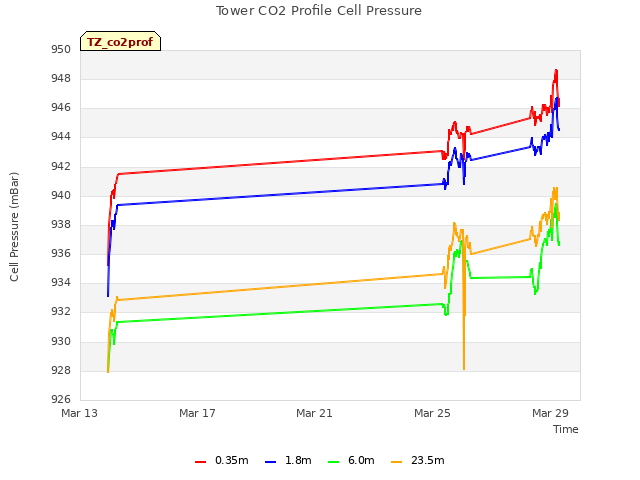
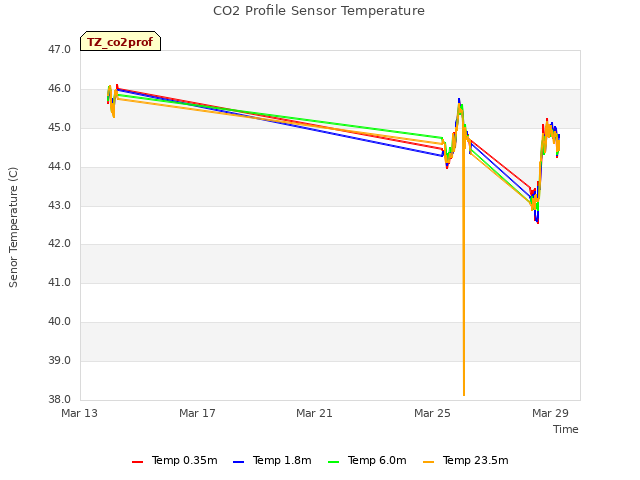
3 TZ_co2prof graphs found
No data found for TZ_irt.
1 TZ_windprof graphs found
No data found for TZ_tflux.
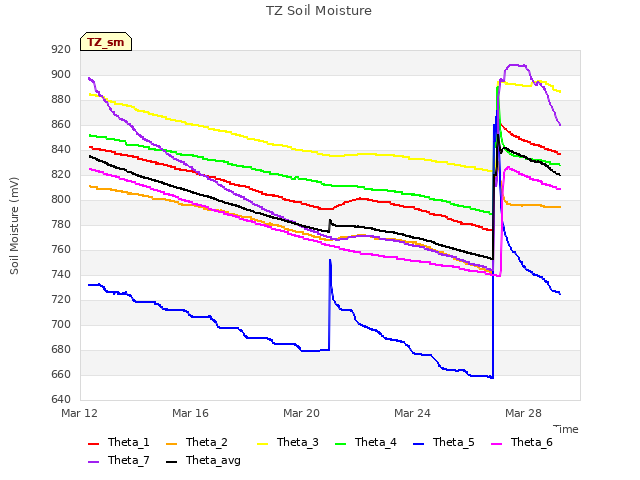
2 TZ_sm graphs found

Can't check TZ_met
1 TZ_met graphs found
Can't check TZVR_mixed
No data found for TZ_osu.
No data found for TZ_fd.
Tonzi Z-cam data


