Field Notes
<--2007-03-13 00:00:00 |
2007-03-14 10:27:00-->
Other sites visited today:
Tonzi
Phenocam link:
Searching...Tonzi: 2007-03-14 09:30:00 (DOY 73)
Author: Siyan Ma
Others: Youngryel, Ted
When: Date: 3/14/2007 ,
Day: 73 ,
Watch Time: 9:30 am .
Where: Tonzi/Vaira Ranch
Who: Siyan and Youngryle (Met Ted at Vaira and
Tonzi)
Weather:
clear with slight white clouds, a beautiful day
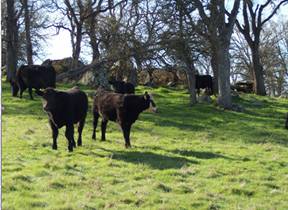
Phenology:
grasses grow a lot. LAI ~1.5 at
Vaira. See cows at Vaira. Seem only small cows were left. Oak leaf
hasn’t come out yet. See some leaf-out
on the way back.
 Summary
- Flux system worked all well
at Tower, Floor, and Vaira.
- correct PC and datalogger
time with GPS at tower and floor sites. There are a few minutes delay before GPS
shows stable Time reading.
- grass sample for LAI and
phenology in Tower and Vaira
- soil moisture at Vaira and
Tower
- dendrometer
- spectrometer (Youngryle)
Vaira_Grass
Site
- Fence and gate power: >12 v.
- Panel and Batteries: 13.9 v; 15.2 amps; 3.0 amps.
- Reading from Gillsonic screen
before downloading data. (The value
of H2O and CO2 should be in the range of 0 – 5 v.)
Time
|
8:39:00
|
Path/File name
|
D:\Data\V07_ 073
.flx
D:\Data\VR070730800 .raw
|
|
mean
|
std
|
|
mean
|
std
|
w
|
0.04
|
0.208
|
Ts
|
18.64
|
0.59
|
u
|
0.31
|
0.27
|
H2O
|
2.56
|
0.16
|
v
|
0.50
|
0.615
|
CO2
|
2.08
|
0.05
|
|
|
|
Tc
|
1.672
|
0.089
|
- downloading data: OK
- check the fans of air temp.
and relative humidity sensors at Vaira. OK
- Check MD-9 system connections:
OK
- Check levels of Radiation
sensors, clear up surfaces. Done!
9. Closed gate and
set up fence.
Tonzi_Tower Site
- Fence and gate power: >12 v.
- Panel and Batteries: 13.8 v; 0.0 amps; 6.2 amps.
- Reading from Gillsonic screen
before downloading data. (The value
of H2O and CO2 should be in the range of 0 – 5 v.)
Time
|
|
Path/File name
|
D:\Data\T07_
.flx
D:\Data\TW07 .raw
|
|
mean
|
std
|
|
mean
|
std
|
w
|
-0.69
|
0.87
|
Ts
|
20.6
|
0.763
|
u
|
3.3
|
1.624
|
H2O
|
3.16
|
1.105
|
v
|
1.94
|
0.774
|
CO2
|
1.86
|
0.023
|
- downloading data OK
- check the fans of air temp.
and relative humidity sensors on the tower and the floor. OK
- Check calibration cylinders;
CO 2 1400 psig; flow 20
psi.
N 2 1200
psig; flow 20 psi.
Ted showed me how
to check the CO2 values. Click
“Ports/Flags” button to see which ports or flags is setting high. Pressure should be less than ambient value. When Flag 8 is high, it may indicate that
RRR’s battery is low.
- close gate and set up fence.
Toniz_Floor
Site
- Fence and gate power: >12 v.
- Panel and Batteries: 13.7 v; 11.1 amps; 1.7 amps.
- Reading from Gillsonic screen
before downloading data. (The value
of H2O and CO2 should be in the range of 0 – 5 v.)
Time
|
|
Path/File name
|
D:\Data\F07_
.flx
D:\Data\FL07 .raw
|
|
mean
|
std
|
|
mean
|
std
|
w
|
0.09
|
0.165
|
Ts
|
18.8
|
0.625
|
u
|
0.11
|
0.733
|
H2O
|
2.24
|
0.142
|
v
|
0.99
|
0.156
|
CO2
|
2.03
|
0.017
|
- downloading data: OK
- Check MD-9 system connections:
OK
CR23X3 – floor-Met
CR23X5 – soil CO 2
profile
CR23X6 – tower-Met
CR10X2 – floor-Met
CR10X4 – sap-flow: #5 -99999
CR10X7 – CO 2 profile
CR10X8 – wind profile
- Soil CO2 profile
Reading
from datalogger
Panel
temp
|
25.2
|
|
|
Battery
voltage
|
13.3
|
|
|
CO2E_1
|
1039
|
TCE_1
|
21.9
|
CO2W_1
|
1098
|
TCW_1
|
19.4
|
CO2E_2
|
1936
|
TCE_2
|
22.0
|
CO2W_2
|
1767
|
TCW_2
|
17.1
|
CO2E_3
|
2327
|
TCE_3
|
17.6
|
CO2W_3
|
2898
|
TCW_3
|
16.1
|
CO2E_4
|
3068
|
TCE_4
|
14.7
|
CO2W_4
|
5114
|
TCW_4
|
16.8
|
Reading
from panels of analyzers
depth
|
Open
|
order
|
depth
|
Tree
|
order
|
2cm
(1%)
|
2100
|
1
|
2cm
(1%)
|
2090
|
1
|
4cm
|
4030
|
2
|
4cm
|
3710
|
4
|
8cm
|
6730
|
3
|
8cm
|
1.15%
|
2
|
16cm
|
6200
|
4
|
16cm
|
1.02%
|
3
|
- Close gate and set up fence.
tonzi
|
7931AFE
|
402165
|
574B4B
|
402FF3
|
574632
|
7A432E
|
7A3C6E
|
7A3B40
|
7A4AAA
|
16-Mar-07
|
73
|
|
|
|
|
|
|
|
|
|
SM
|
|
|
|
|
|
|
|
|
0-15
|
33.5
|
23.7
|
34.4
|
24.9
|
29.6
|
28.2
|
23.1
|
19.4
|
14.9
|
15-30
|
38.9
|
34.7
|
40.1
|
35.2
|
38.1
|
21.8
|
31.3
|
29.8
|
17.0
|
30-45
|
40.5
|
42.3
|
46.2
|
40.3
|
47.2
|
27.4
|
33.8
|
32.0
|
32.8
|
45-60
|
43.7
|
63.2
|
59.7
|
46.4
|
44.0
|
32.1
|
36.5
|
45.4
|
27.0
|
|
|
|
|
|
|
|
|
|
|
|
A6D882B
|
A3D04E8
|
A6D72F5
|
|
|
|
|
|
|
|
|
|
|
|
|
|
|
|
|
0-15
|
31.3
|
27.5
|
15.6
|
|
|
|
|
|
|
15-30
|
22.4
|
25.4
|
28.3
|
|
|
|
|
|
|
30-45
|
33.4
|
33.8
|
34.0
|
|
|
|
|
|
|
45-60
|
42.2
|
50.2
|
48.7
|
|
|
|
|
|
|
|
|
|
|
|
|
|
|
|
|
vaira
|
57318a
|
7933dee
|
|
|
|
|
|
|
|
0-15
|
14.3
|
15.3
|
|
|
|
|
|
|
|
15-30
|
21.9
|
25.5
|
|
|
|
|
|
|
|
30-45
|
25.0
|
27.0
|
|
|
|
|
|
|
|
45-60
|
29.4
|
34.4
|
|
|
|
|
|
|
|
Tonzi
|
|
|
|
Dendrometer
|
|
|
|
|
|
|
Date
|
Day
|
Tag #
|
Reading (cm)
|
3/14/2007
|
73
|
71
|
23.8
|
|
|
72
|
23.8
|
|
|
77
|
Broken
|
|
|
78
|
Broken
|
|
|
79
|
23.4
|
|
|
245
|
22.7
|
|
|
248
|
24.8 (out of range)
|
|
|
250
|
21.9
|
|
|
255
|
21.9
|
|
|
252
|
missing
|
|
|
102
|
Broken
|
|
Field Data
No tank data
No TZ Well data found
No TZ Moisture Point data found
No VR Moisture Point data found
No TZ grass heigth found
No VR grass heigth found
No TZ Tree DBH found
No water potential data found
No TZ Grass Biomass data found
No TZ OakLeaves Biomass data found
No TZ PineNeedles Biomass data found
0 photos found
16 sets found
No data found for TZ_Fenergy.
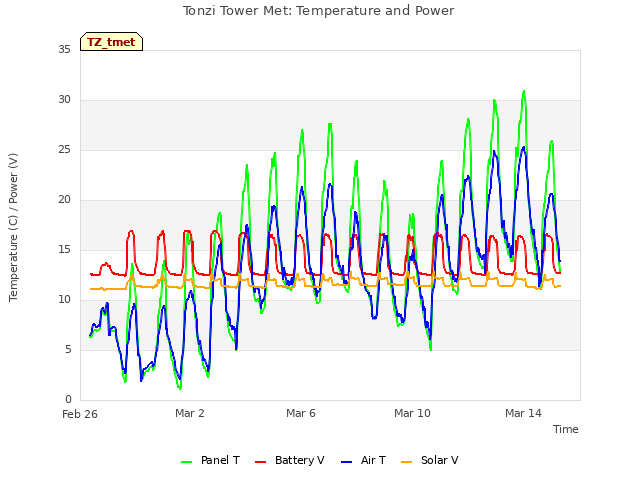
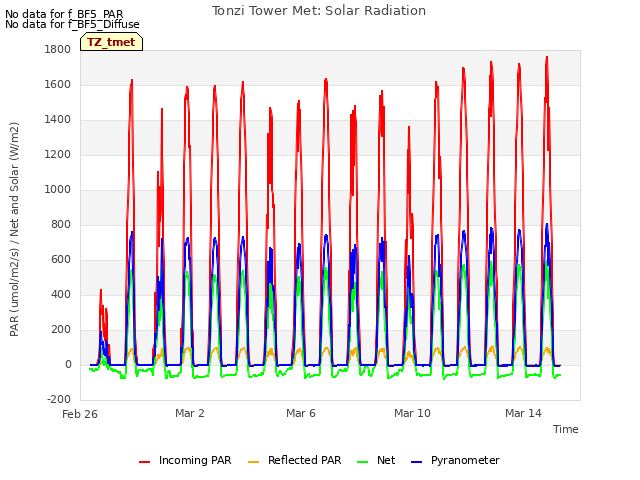
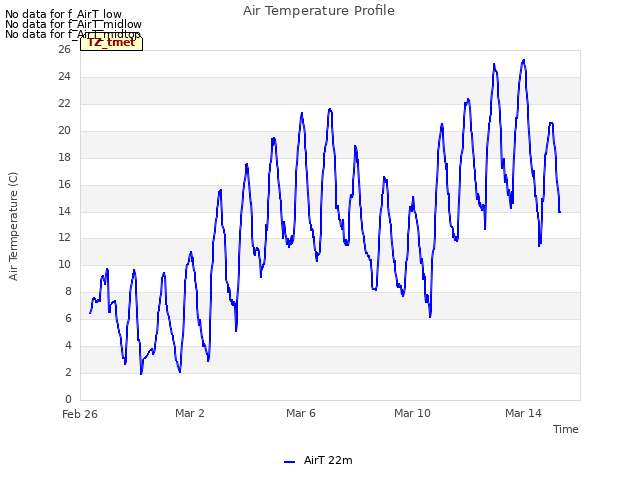
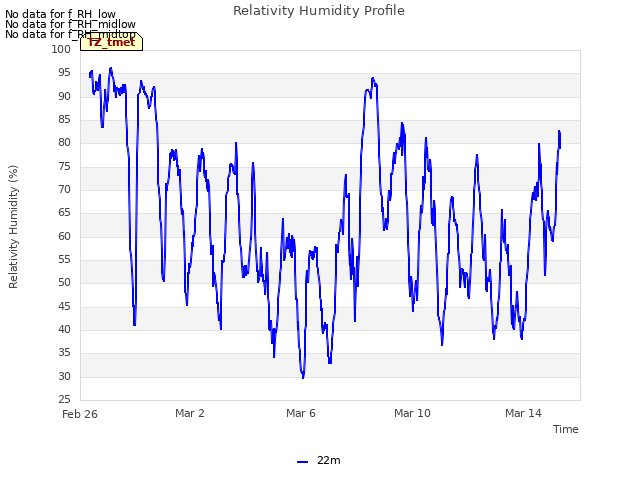
11 TZ_tmet graphs found


No data found for TZ_soilco2.
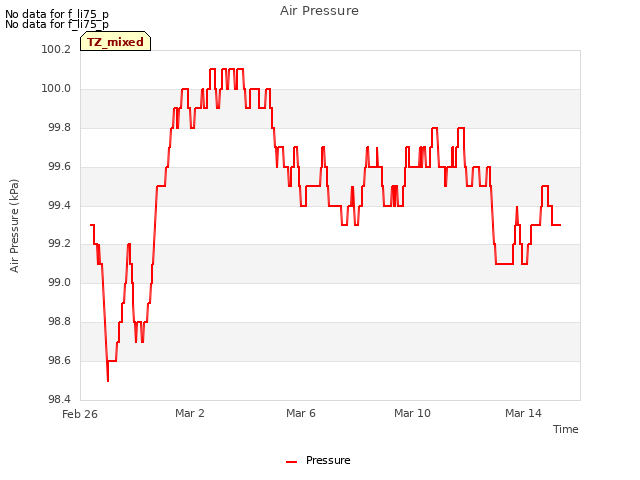
Can't check TZ_mixed
3 TZ_mixed graphs found

No data found for TZ_fflux.
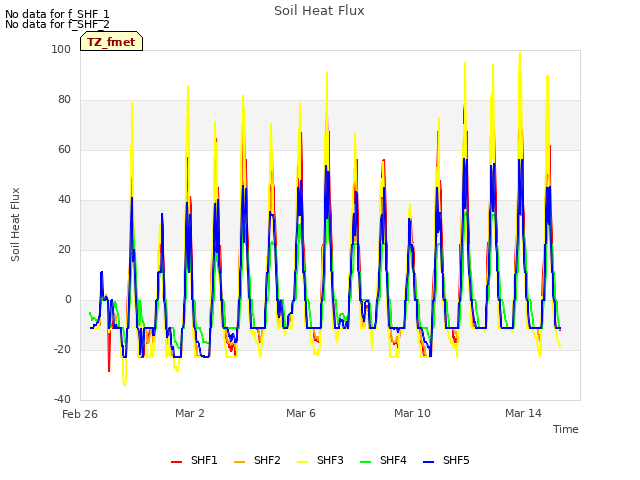
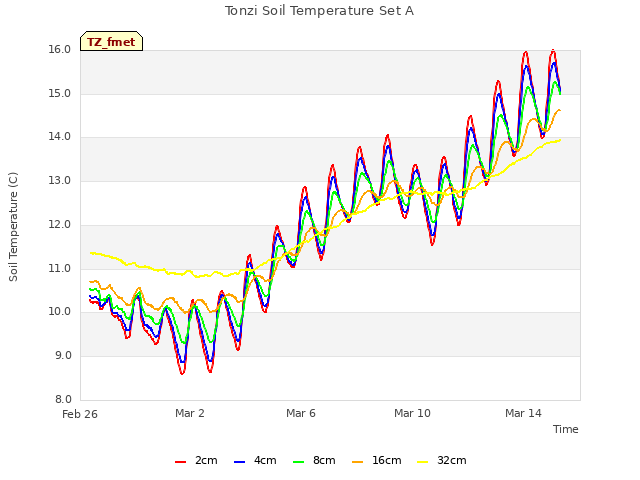
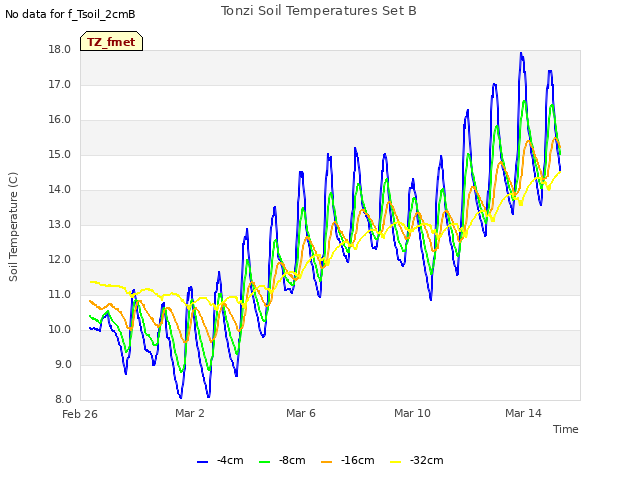
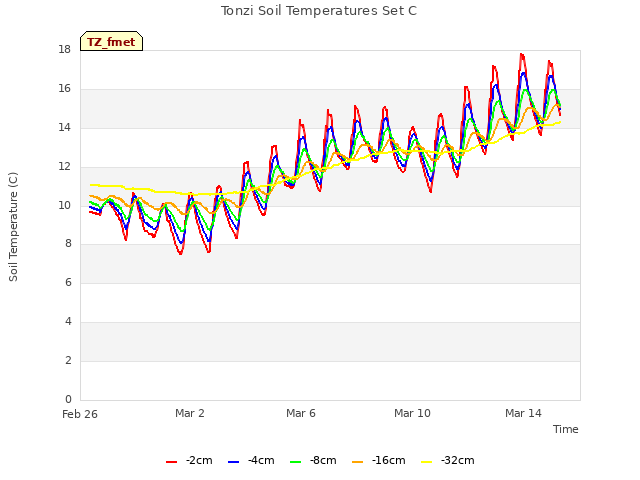
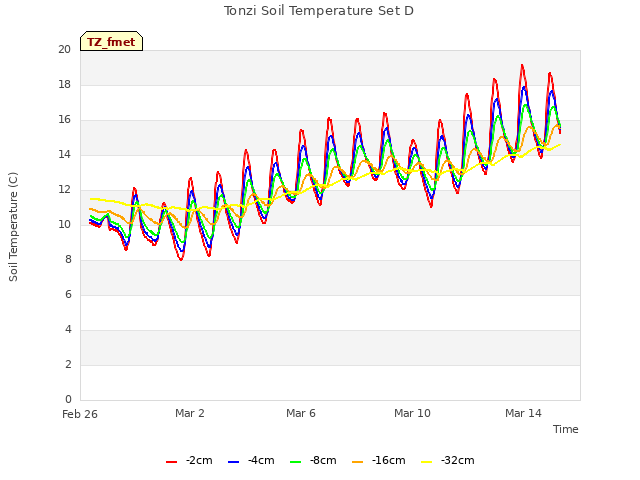
8 TZ_fmet graphs found


No data found for TZ_tram.
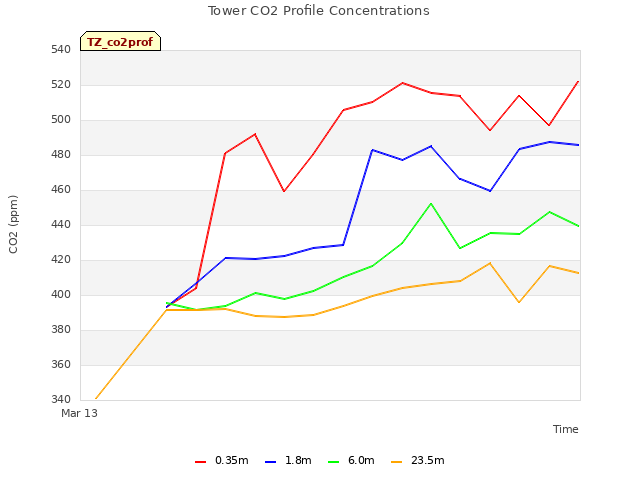
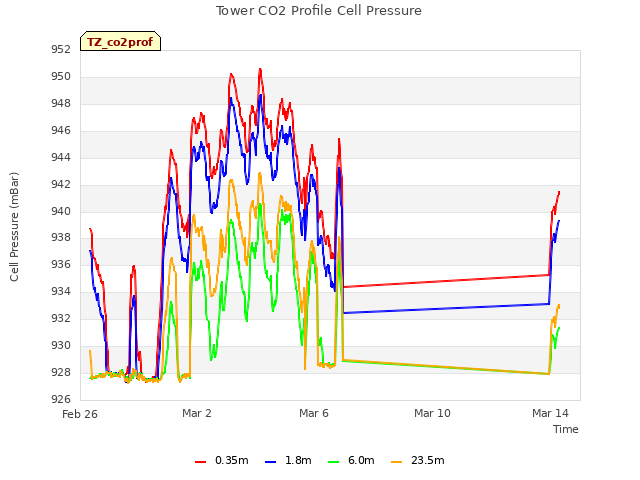
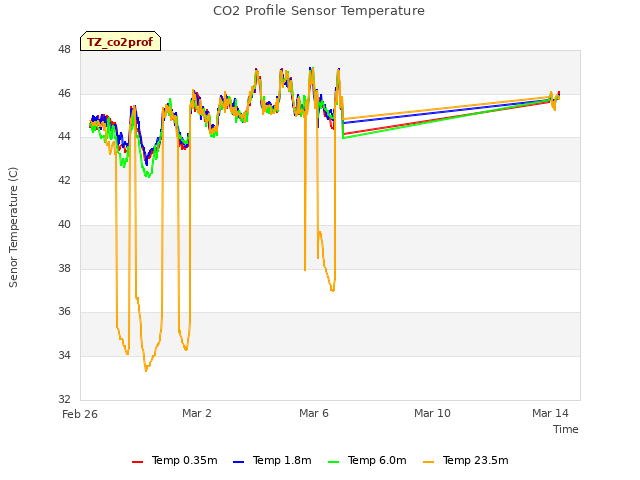
3 TZ_co2prof graphs found
No data found for TZ_irt.
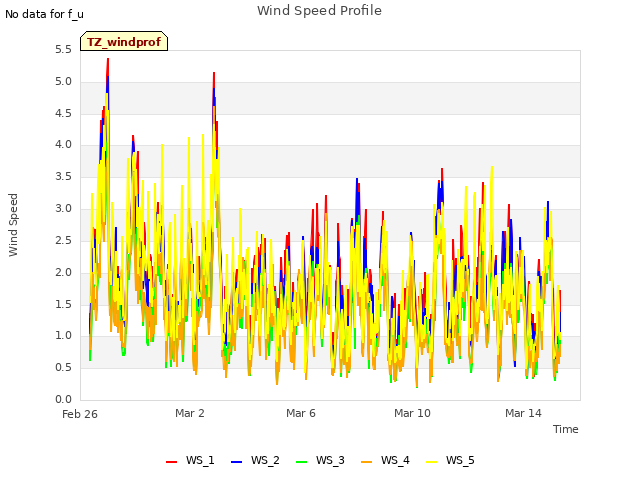
1 TZ_windprof graphs found
No data found for TZ_tflux.
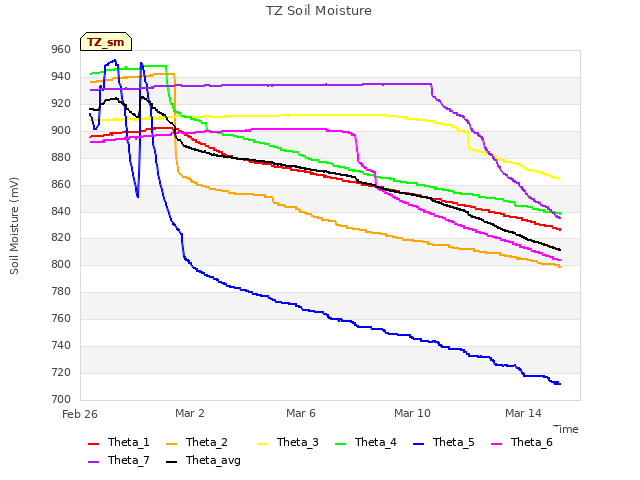
2 TZ_sm graphs found

Can't check TZ_met
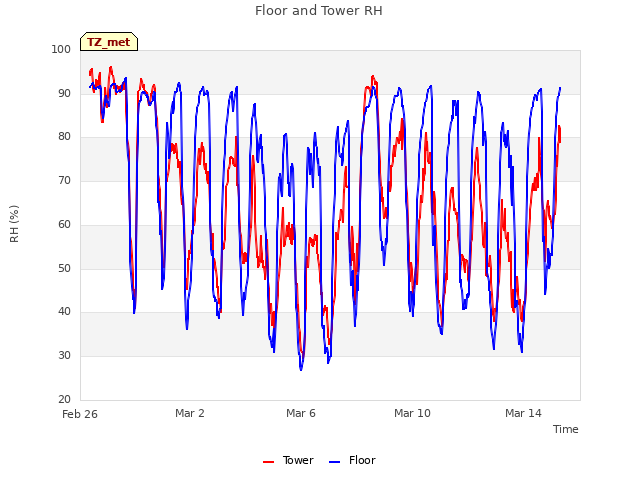
1 TZ_met graphs found
Can't check TZVR_mixed
No data found for TZ_osu.
No data found for TZ_fd.
Tonzi Z-cam data


